These release notes give an overview of the changes for the 2022-32.x to 2022-39.x releases of the VMware Tanzu Observability (formerly known as VMware Aria Operations for Applications) service.
2022-39.x Release Notes
|
Hide Warning Messages on Charts: You can now turn off the warning icons for all charts in a dashboard from the Dashboard Settings dialog. See Set Dashboard Display Preferences and Settings. |
2022-36.x Release Notes
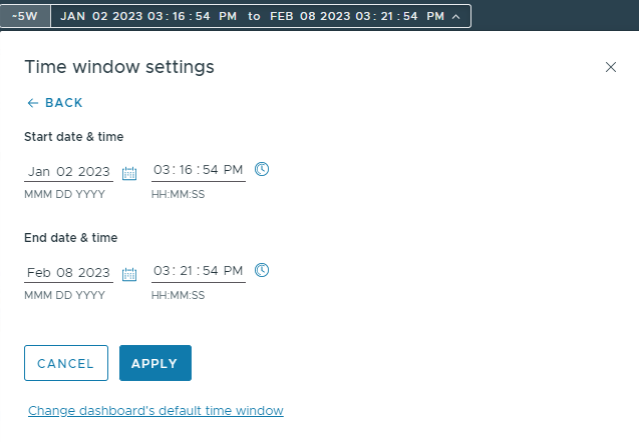
- Accessibility and Keyboard Navigation Improvements: When you set a custom time window for a dashboard or a chart, in the Time window picker, you can now use the keyboard to enter the months for the start and end dates.
- Integrations: We had an integrations release in September! We made a lot of bug fixes and significant improvements to a number of integrations. See the Integration Release Notes for details.
2022-35.x Release Notes
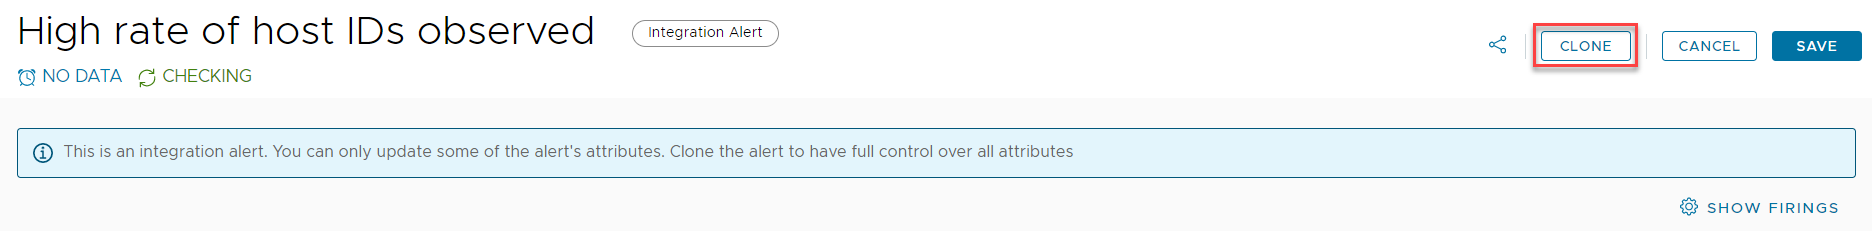
Improved System Alerts Experience: Some integrations contain predefined system alerts. We have made several user experience improvements:
- No settings can be edited in Preview mode.
- All settings that cannot be modified in Edit mode are now shown as non-editable.
- We have implemented a Clone button on top of each system integration alert. The button allows you to easily clone the integration alert right after you open it in Edit mode.
2022-34.x Release Notes
We published several new videos to VMware TV:
- Operator for Kubernetes
- TAS Monitoring and Alerting with Tanzu Observability
- Integrating TAS with Tanzu Observability: How to Get Started
You can watch the videos in the Integrations for Tanzu Observability playlist:
2022-33.x Release Notes
We’ve made the following improvements to the Wavefront service:
- The Usage Limit chart on the ingestion policy dashboard now shows the P95 usage by the policy out of the PPS limit.
- Integrations: The August 2022 integrations release was made available! We made significant improvements to a number of integrations and also added the VMware Tanzu Greenplum integration. See the Integration Release Notes for details.
Concurrently with this release, we’ve just released Wavefront Proxy 11.4.
- Added the following internal metrics for proxy logs:
~proxy.logs.*.received.messageLength: Size of log message fields before validation~proxy.logs.*.received.tagLength: Size of label per log message~proxy.logs.*.received.batches: Number of incoming batches of logs
- For preprocessor rules
extractTagandextractTagIfNotExists, applied rule to tag key values when source is pointLine. - Improved accuracy of exponential delta histograms at the lowest percentiles.
- Completed fix to block points with EOT characters.
- Fixed an issue where the span log sampling policy was not synced with the Wavefront server.
- Updated the dependency versions.
2022-32.x Release Notes
|
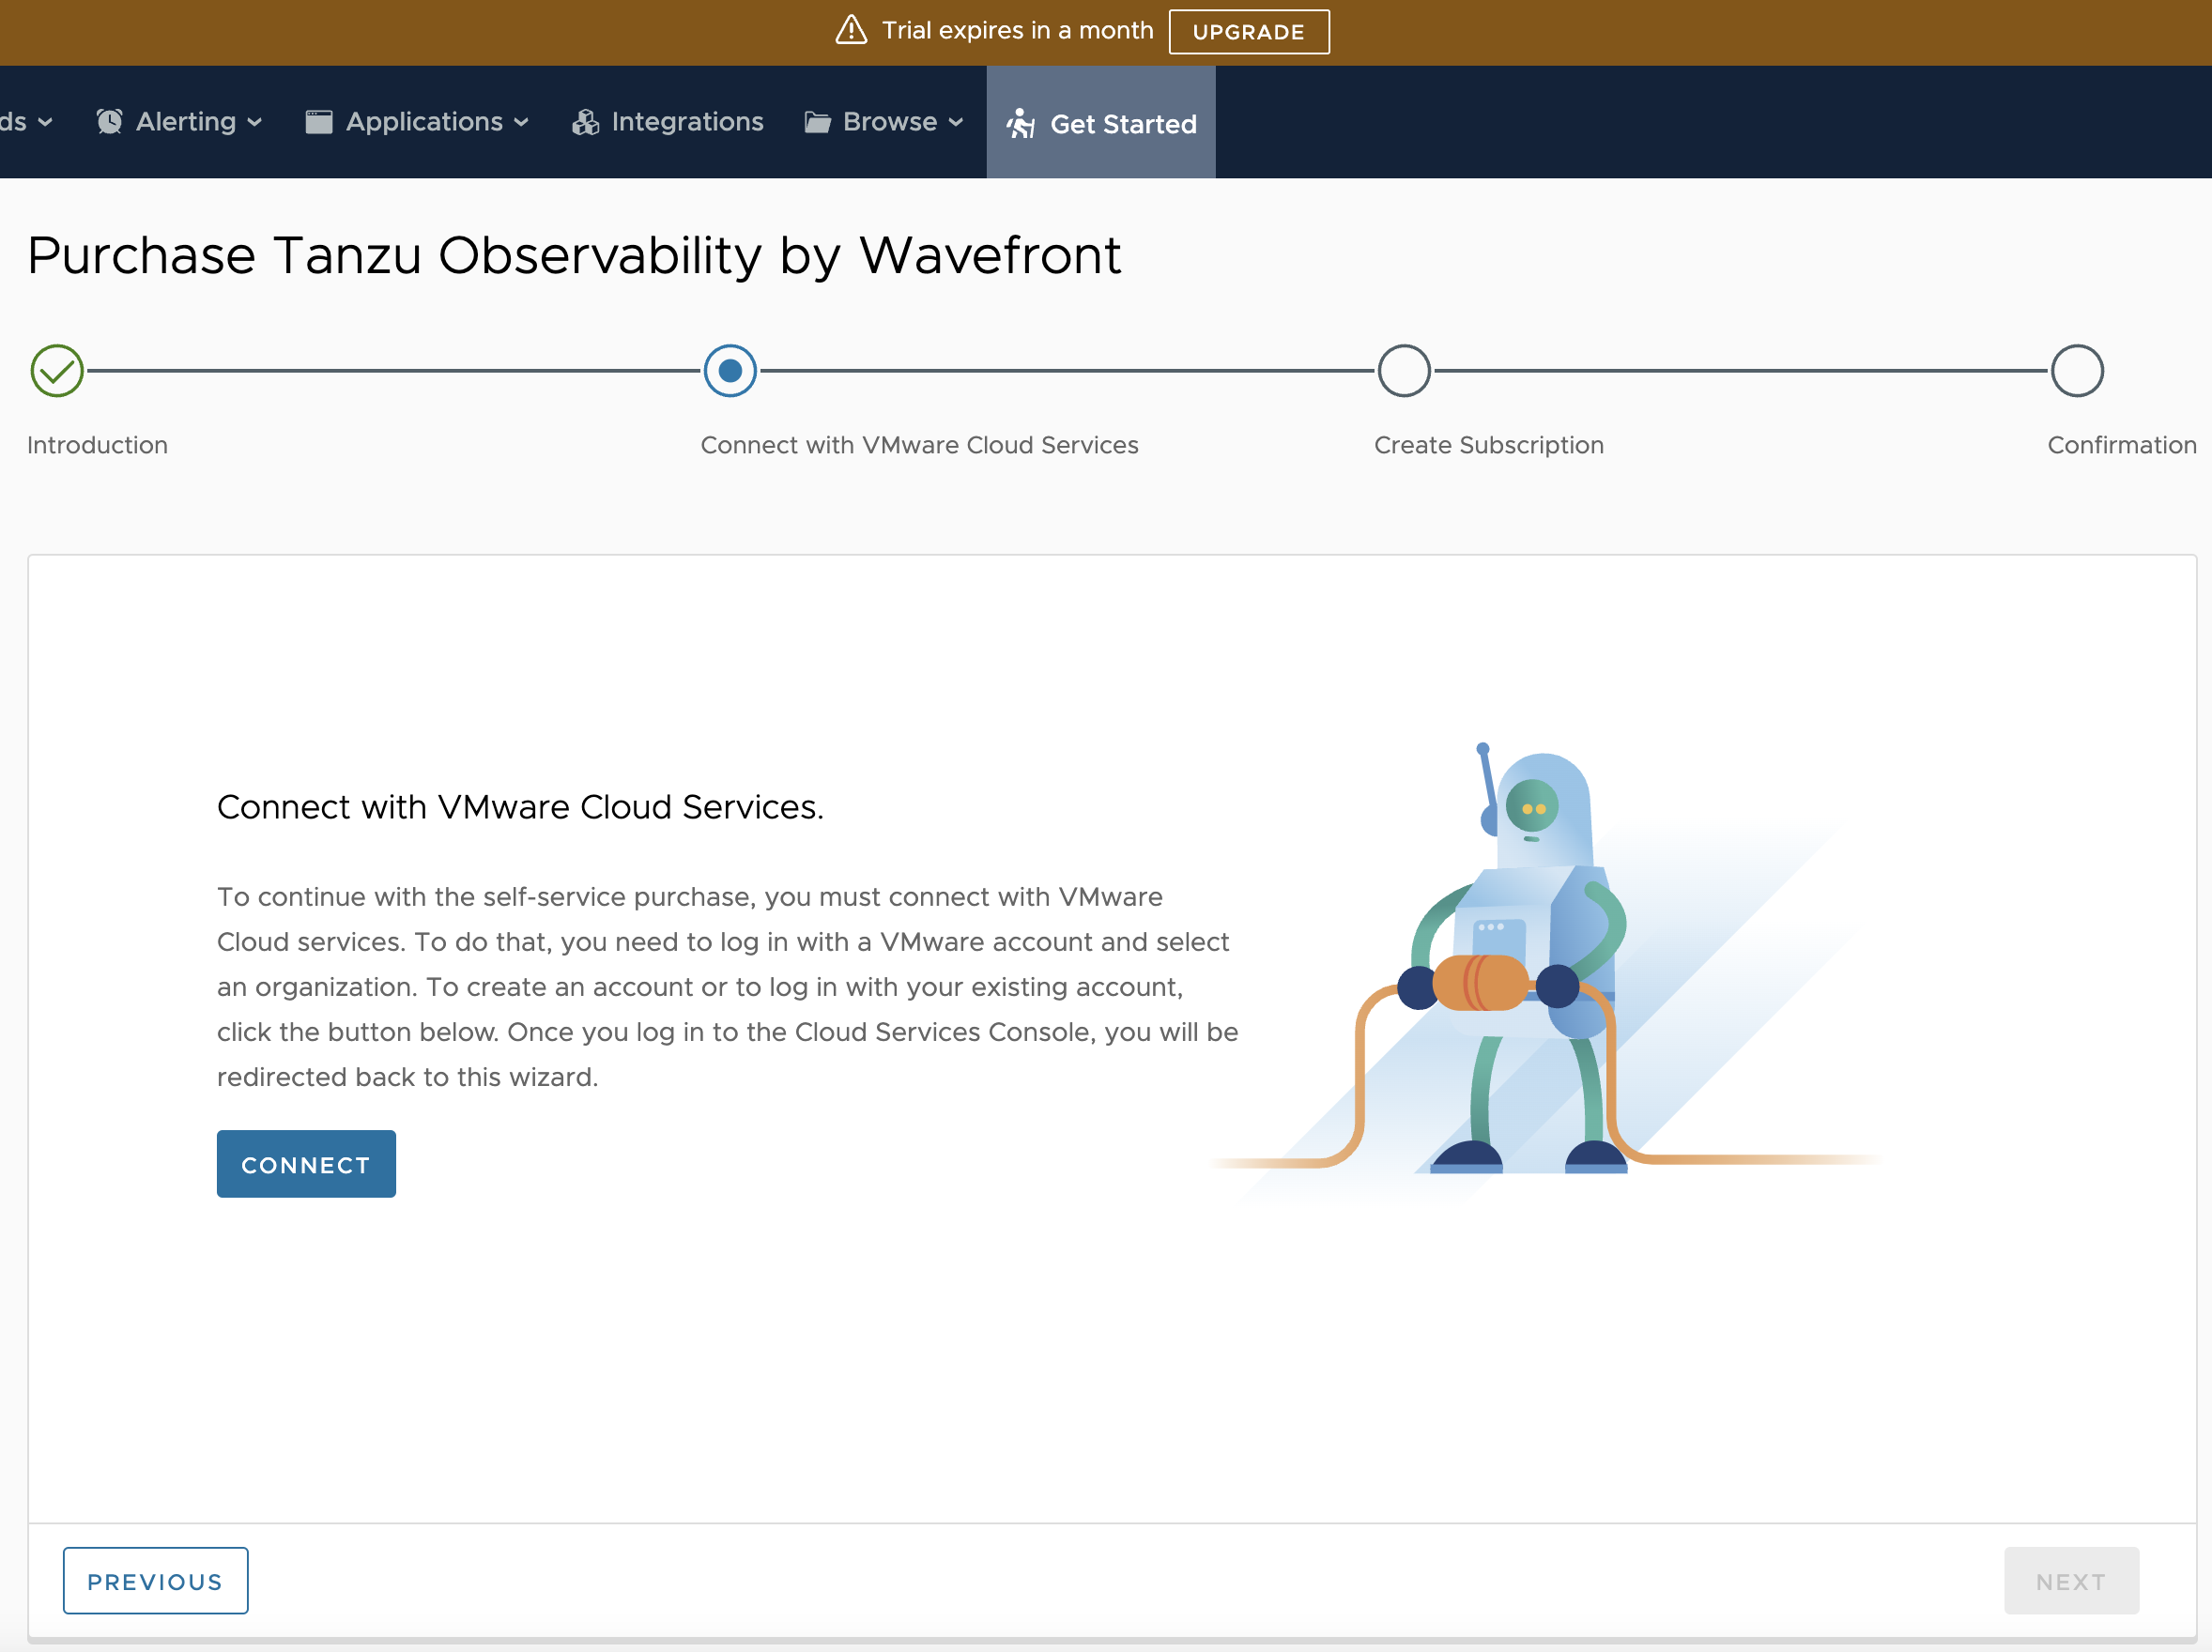
Self-Service Upgrade From a Trial Version: Super Admin users can now upgrade from a trial version and purchase Tanzu Observability. Note: The self-service upgrade from a trial version currently supports only monthly billable commit contracts.
|
|
|
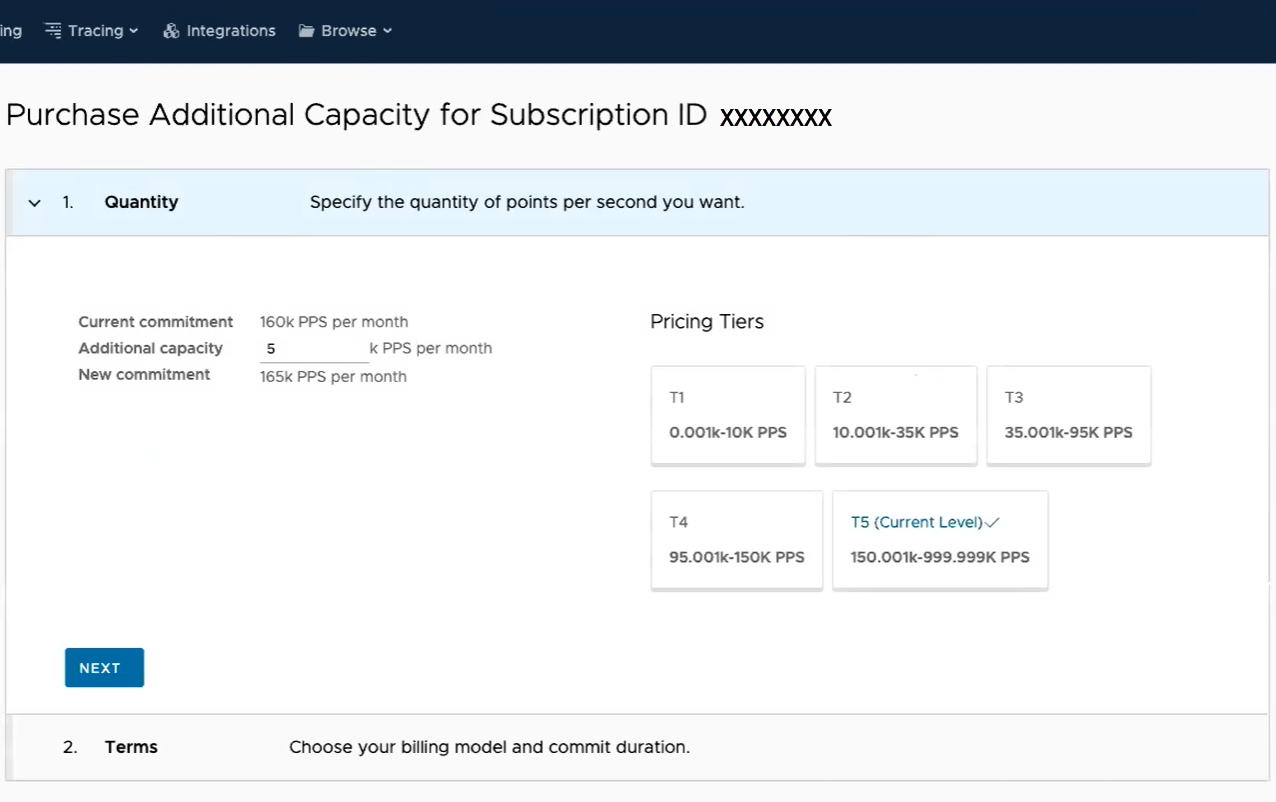
Self-Service Purchase of Additional Tanzu Observability Capacity
We extended the Usage Portal to Usage and Subscriptions, so Super Admin users can now add more capacity to their existing Tanzu Observability subscriptions. Note: The self-service purchase of additional capacity is currently available only to customers with monthly billable commit contracts who have connected their Wavefront instances to VMware Cloud Services organizations.
|
|
|
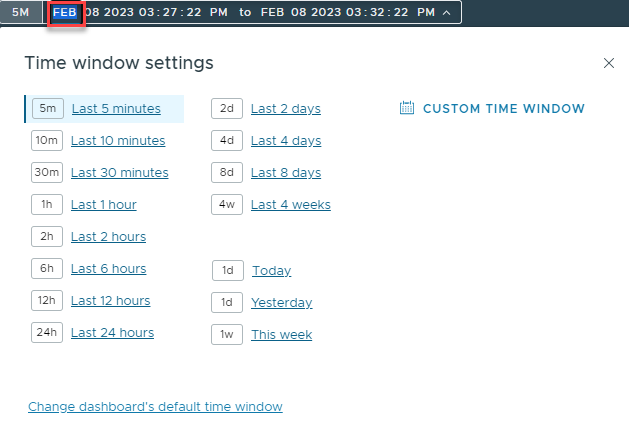
Time Window Picker Changes: We have updated the time window picker for dashboards. You now can see two tabs on it:
See Set the Time Window for details. |
|