This page provides an overview of what you can do with the Telegraf integration. The documentation pages only for a limited number of integrations contain the setup steps and instructions. If you do not see the setup steps here, navigate to the Operations for Applications GUI. The detailed instructions for setting up and configuring all integrations, including the Telegraf integration are on the Setup tab of the integration.
- Log in to your Operations for Applications instance.
- Click Integrations on the toolbar, search for and click the Telegraf tile.
- Click the Setup tab and you will see the most recent and up-to-date instructions.
Telegraf Integration
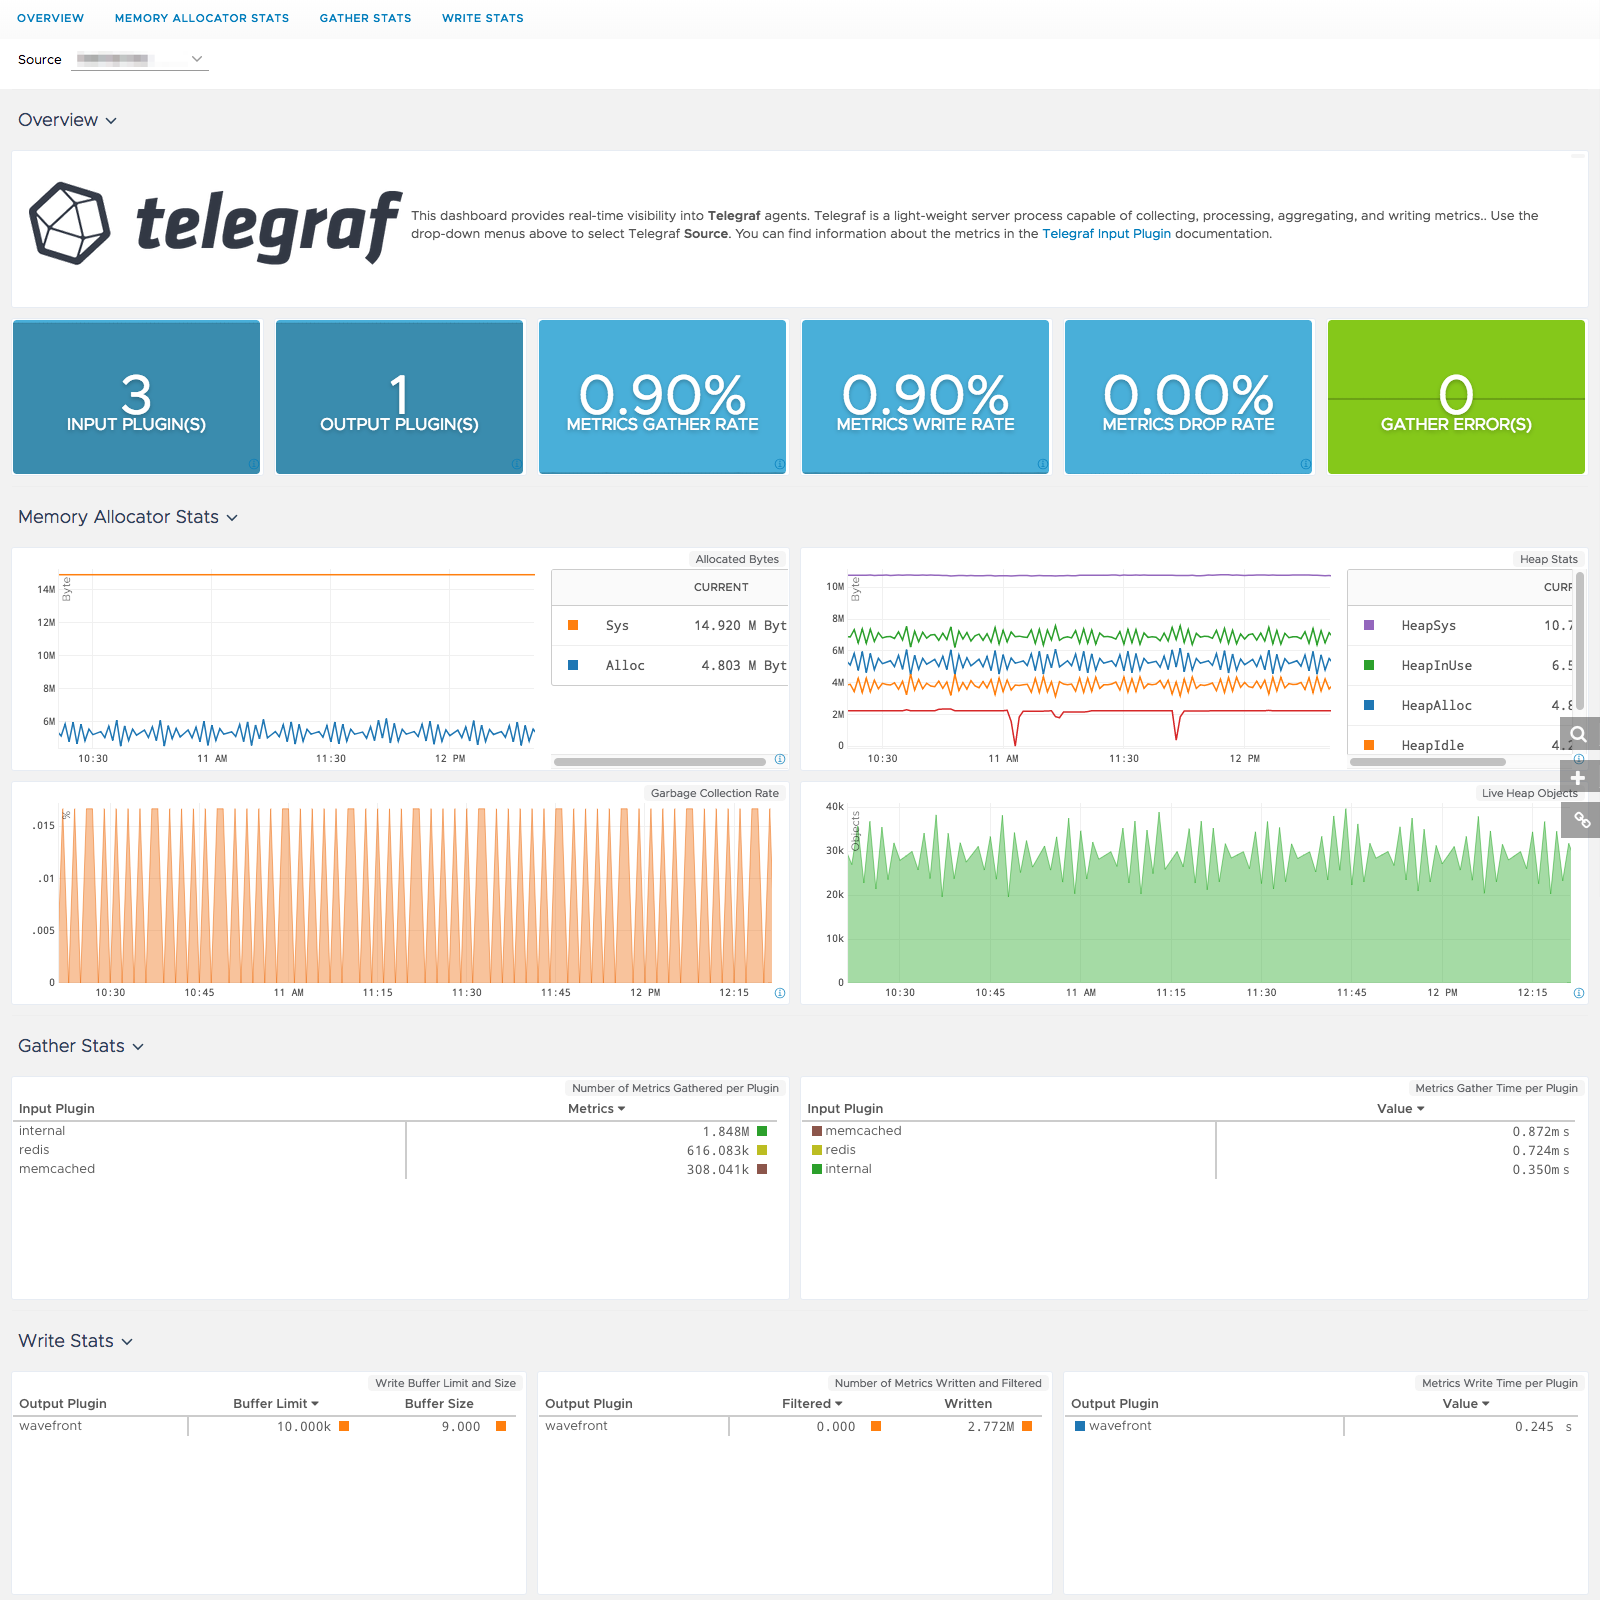
Telegraf is a light-weight server process capable of collecting, processing, and aggregating metrics. This integration describes how to install and configure Telegraf to send metrics to a Wavefront proxy.
In addition to setting up the metrics flow of the system and the applications, this integration also allows you to monitor the performance of Telegraf and installs a dashboard. Here’s a preview of Telegraf dashboard:
Note: Telegraf dashboard shows NO DATA if the internal plugin is not enabled.
Metrics
This table has Telegraf integration metrics with its description. You can also see the metrics list on the Github page.
| Metric Name | Description |
|---|---|
| telegraf.internal.agent.gather.errors | Aggregate stats for errors on all telegraf plugins |
| telegraf.internal.agent.metrics.dropped | Aggregate stats for metrics dropped on all telegraf plugins |
| telegraf.internal.agent.metrics.gathered | Aggregate stats for metrics gathered on all telegraf plugins |
| telegraf.internal.agent.metrics.written | Aggregate stats for metrics written on all telegraf plugins |
| telegraf.internal.gather.gather.time.ns | Aggregate stats for gather time on all input plugins that are of the same input type. |
| telegraf.internal.gather.metrics.gathered | Aggregate stats for gathered metrics on all input plugins that are of the same input type. |
| telegraf.internal.memstats.alloc.bytes | Number of bytes allocated |
| telegraf.internal.memstats.frees | Number of bytes freed |
| telegraf.internal.memstats.heap.alloc.bytes | Bytes of allocated heap objects |
| telegraf.internal.memstats.heap.idle.bytes | Bytes in idle spans.Idle spans have no objects in them. These spans may have been returned to the OS, or they can be reused for heap allocations, or they can be reused as stack memory. |
| telegraf.internal.memstats.heap.in.use.bytes | Bytes in in-use spans.In-use spans have at least one object in them. |
| telegraf.internal.memstats.heap.objects | Number of allocated heap objects. Increases as objects are allocated and decreases as the heap is swept and unreachable objects are freed. |
| telegraf.internal.memstats.heap.released.bytes | Bytes of physical memory returned to the OS. This counts heap memory from idle spans that was returned to the OS and has not yet been reacquired for the heap. |
| telegraf.internal.memstats.heap.sys.bytes | Bytes of heap memory obtained from the OS (the amount of virtual address space reserved for the heap. ). |
| telegraf.internal.memstats.mallocs | Cumulative count of heap objects allocated |
| telegraf.internal.memstats.num.gc | Number of completed GC cycles. |
| telegraf.internal.memstats.pointer.lookups | Number of pointer lookups performed by the runtime. |
| telegraf.internal.memstats.sys.bytes | Total bytes of memory obtained from the OS |
| telegraf.internal.memstats.total.alloc.bytes | Bytes of allocated heap objects. |
| telegraf.internal.write.buffer.limit | Aggregate stats about the write buffer limit on all output plugins that are of the same input type. |
| telegraf.internal.write.buffer.size | Aggregate stats about the write buffer size on all output plugins that are of the same input type. |
| telegraf.internal.write.metrics.added | Aggregate stats about the metrics added for all output plugins that are of the same input type. |
| telegraf.internal.write.metrics.dropped | Aggregate stats about the metrics dropped for all output plugins that are of the same input type. |
| telegraf.internal.write.metrics.filtered | Aggregate stats about the metrics dropped for all output plugins that are of the same input type. |
| telegraf.internal.write.metrics.written | Aggregate stats about the metrics written for all output plugins that are of the same input type. |
| telegraf.internal.write.write.time.ns | Aggregate stats about the write time for all output plugins that are of the same input type. |