Summary
cdf(<raw_value>, <hsExpression>)
Cumulative distribution function for histograms. Lets you find out how likely it is that a histogram is less than or equal to a specified value.
Parameters
| Parameter | Description |
|---|---|
| raw_value | The number of interest. For example, if you want to know how close your value is to 4000, specify 4000. The function returns the probability that a value in the histogram is that value. |
| hsExpression | Expression describing the histogram series. |
Description
In many cases, wrapping a histogram expression in percentile() gets you the results you want. For example, you could get the median value for a histogram distribution by using percentile(50, <hsExpression>
If you’re interested in knowing the probability that a point in the distribution is, for example, greater or smaller than a specified value you can use the cdf() function.
Example
The following example uses a version of our Beachshirts demo.
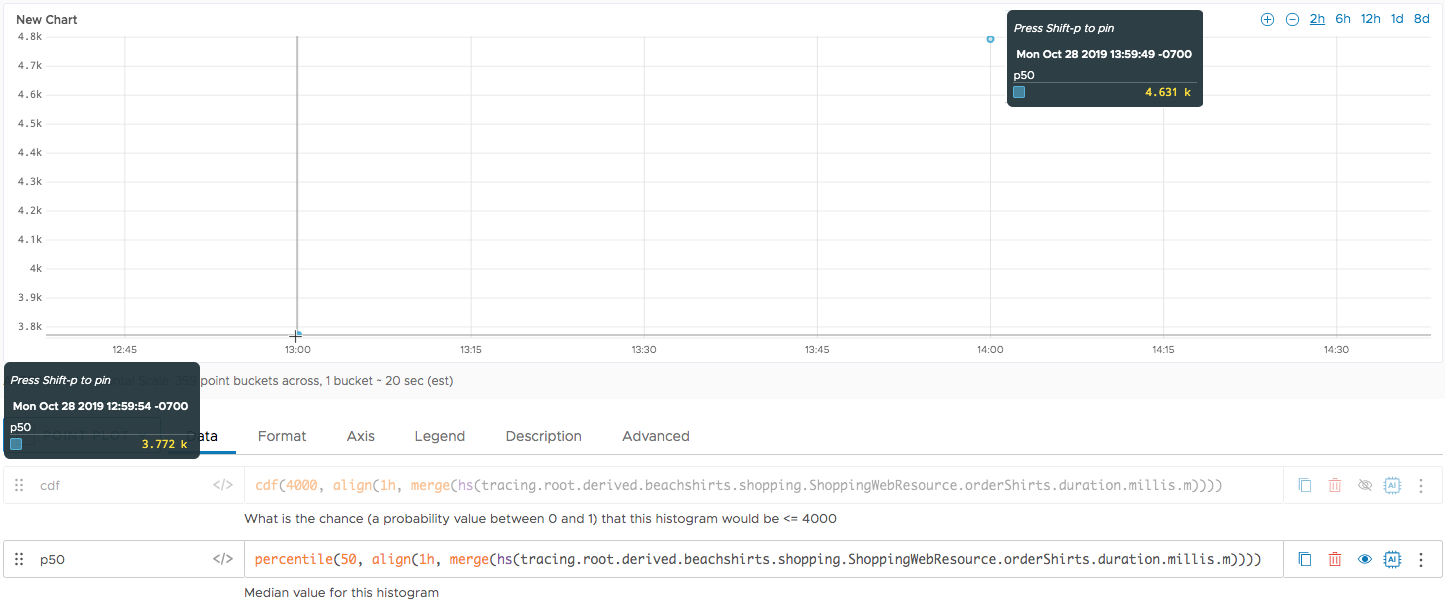
Find the Median with percentile()
First, we’re using the percentile() function with the histogram, in this example, we use the following function to get the median per hour. Using a point plot, we get two points.
percentile(50, align(1h, merge(hs(tracing.root.derived.beachshirts.shopping.ShoppingWebResource.orderShirts.duration.millis.m))))
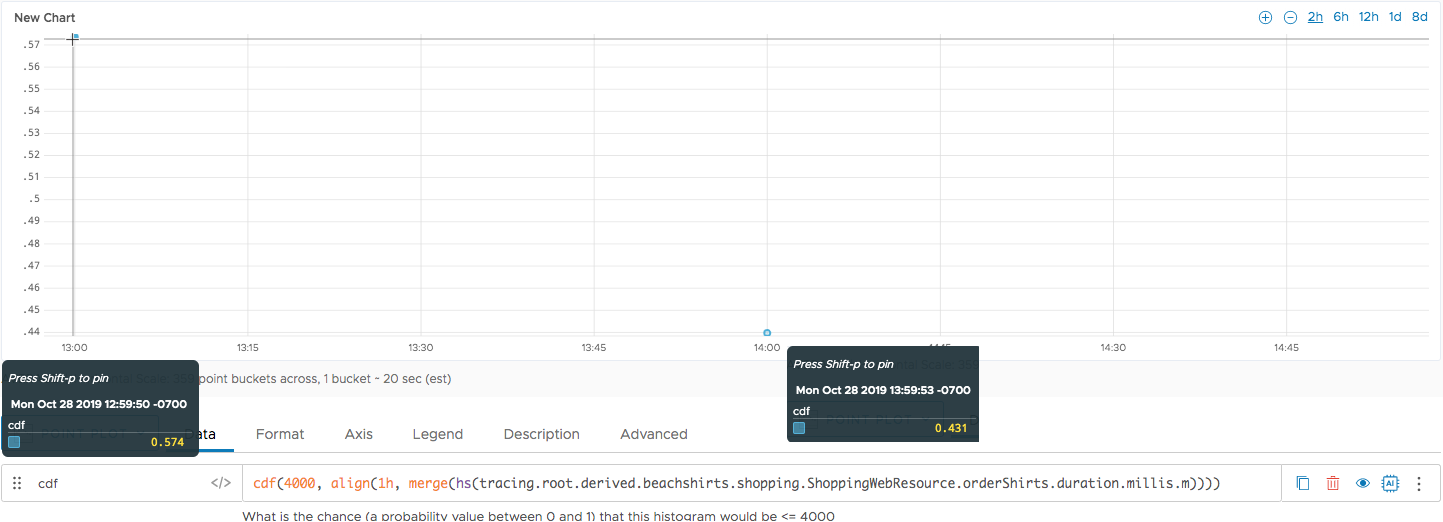
Find the Probability with cdf()
We can use the cdf() function to determine how likely it is that the merged histogram distribution is less than or equal to 4000. We run the following function and get two points.
We saw earlier that the median for the point at 13:00 is 3.772 k and the median for the point at 14:00 is 4.631 k, so the results are in line with the data we have.