Summary
retainSeries(<tsExpression>, <filter1> [and|or [not] <filter2>] ... )

where <filterN> is:
    <metricName> | source="<sourceName>" | tag="<sourceTagName>" | <pointTagKey>="<pointTagValue>"
Filters the expression to display only the time series that match one or more filters, which might be any combination of metric names, source names, source tags, or point tags.
Parameters
| Parameter | Description |
|---|---|
| tsExpression | Expression that describes the time series you want to filter. |
| <metricName>|source=|tag=|<pointTagKey>= | A metric, source, source tag, or point tag to filter by. You must specify at least one filter, which can be of any type. Use Boolean operators to combine multiple filters. For example, (source=app-1 or source=app-2) and env=dev. |
Description
The retainSeries() function filters the expression to display only the time series that match the specified metric, source, source tag, point tag, or combination of these filters. To filter the expression to display only the time series that do not match one or more filters, use removeSeries().
You might be able to use the retainSeries() function to retain only the series that have the synthetic point tag that you define, for example, in conjunction with taggify().
In contrast to filter(), this function supports matching a source tag.
Examples
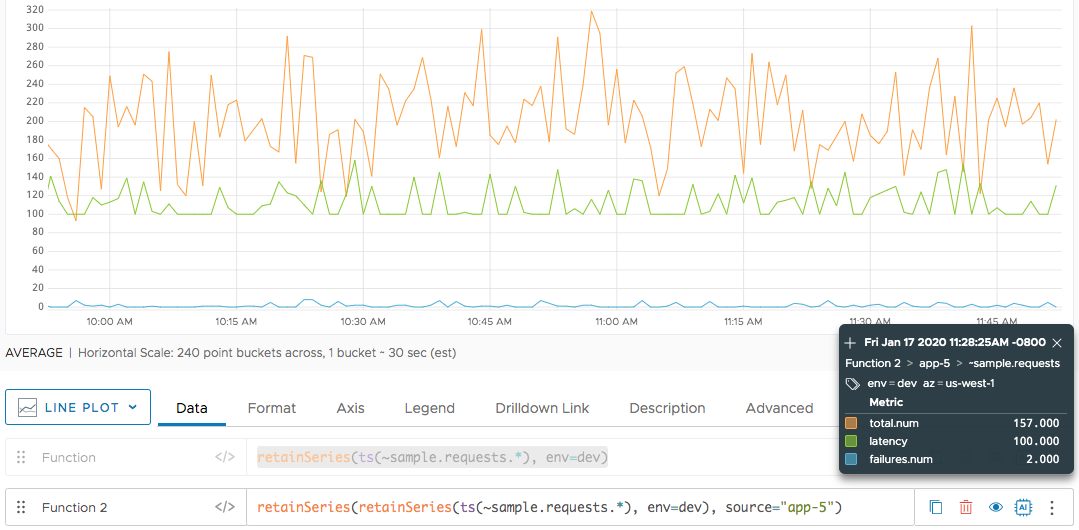
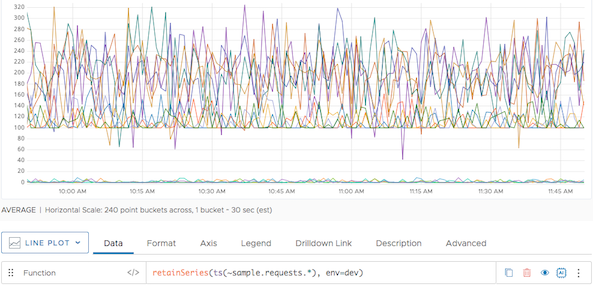
In the following example, we first extract all ~sample.requests.* metrics that are in the dev environment.
Then we extract from that series only the series that come from the app-5 source. The resulting chart displays just three series.