Summary
variance(<tsExpression>[,metrics|sources|sourceTags|pointTags|<pointTagKey>])
Returns the variance based on the set of time series described by the expression.
The results might be computed from real reported values and interpolated values.
Use rawvariance() if you don’t need interpolation.
Parameters
| Parameter | Description |
|---|---|
| tsExpression | Expression describing the set of time series to return variances for. |
| metrics|sources|sourceTags|pointTags|<pointTagKey> | Optional group by parameter for organizing the time series into subgroups and then returning the variance for each subgroup.
Use one or more parameters to group by metric names, source names, source tag names, point tag names, values for a particular point tag key, or any combination of these items. Specify point tag keys by name. |
Description
The variance() aggregation function computes the variance among data values at each moment in time, across the time series that are represented by the expression.
By default, variance() produces a single series of variances by aggregating data values across all time series. You can optionally group the time series based on one or more characteristics, and obtain a separate series of variances for each group.
If any time series has data gaps, variance() fills them in by interpolation whenever possible.
Grouping
Like all aggregation functions, variance() returns a single series of results by default. You can include a group by parameter to compute separate variances based on groups of time series that share common metric names, source names, source tags, point tags, or values for a particular point tag key.
The function returns a separate series of results corresponding to each group.
You can specify multiple ‘group by’ parameters to group the time series based on multiple characteristics. For example, variance(ts("cpu.cpu*"), metrics, Customer) first groups by metric names, and then groups by the values of the Customer point tag.
zone and ZONE, when you use an aggregation function and apply grouping, we consider zone and ZONE as separate tags. Interpolation
If any time series has gaps in its data, the query engine attempts to fill these gaps with interpolated values before applying the function. A value can be interpolated into a time series only if at least one other time series reports a real data value at the same moment in time.
Within a given time series, an interpolated value is calculated from two real reported values on either side of it. Sometimes interpolation is not possible–for example, when a new value has not been reported yet in a live-view chart. In this case, the query engine finds the last known reported value in the series, and assigns it to any subsequent moment in time for which a real reported data value is present in some other time series. We use the last known reported value only if interpolation can’t occur and if the last known reported value has been reported within the last 15% of the query time in the chart window.
You can use rawvariance() to suppress interpolation. See Standard Versus Raw Aggregation Functions.
Examples
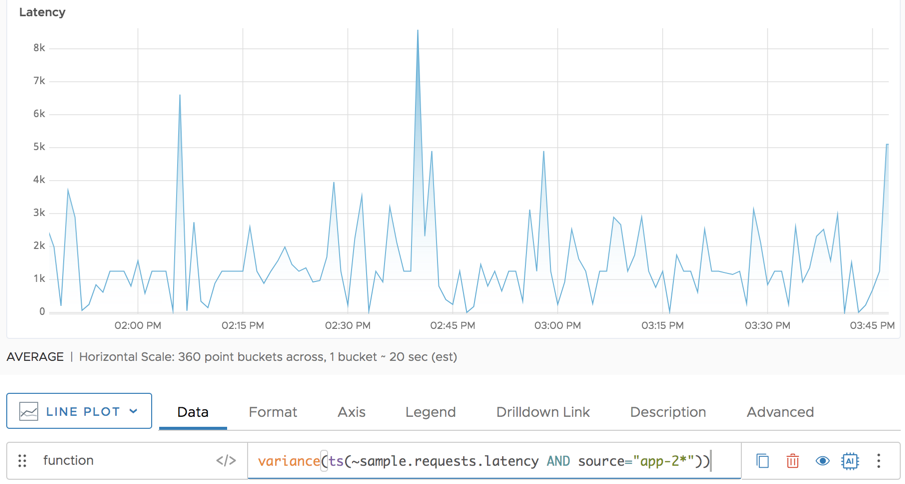
The following example shows the request latency for app-2 and app-20.
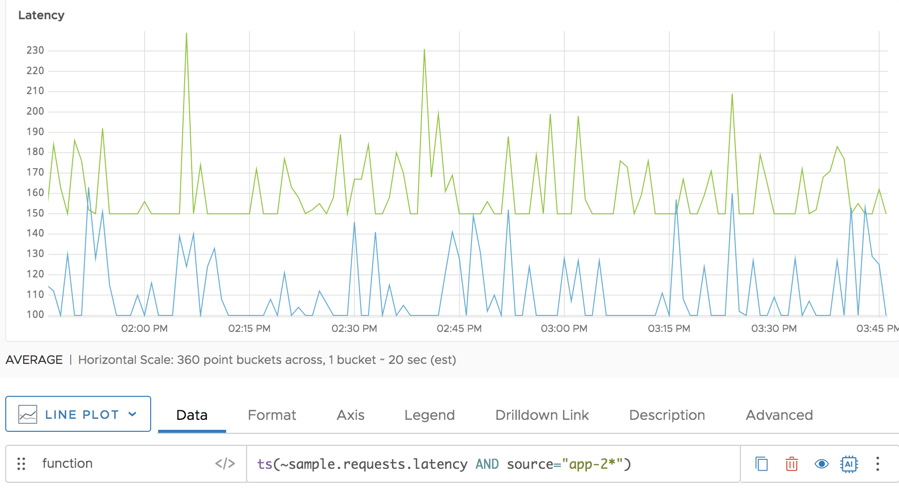
The variance function shows the variance for request latency for the 2 sources in the sample set.