This page provides an overview of what you can do with the Microsoft Azure Files integration. The documentation pages only for a limited number of integrations contain the setup steps and instructions. If you do not see the setup steps here, navigate to the Operations for Applications GUI. The detailed instructions for setting up and configuring all integrations, including the Microsoft Azure Files integration are on the Setup tab of the integration.
- Log in to your Operations for Applications instance.
- Click Integrations on the toolbar, search for and click the Microsoft Azure Files tile.
- Click the Setup tab and you will see the most recent and up-to-date instructions.
Microsoft Azure Integration
The Microsoft Azure integration enables monitoring Azure with Tanzu Observability and offers pre-defined dashboards and alert conditions.
Dashboards
Tanzu Observability provides Microsoft Azure dashboards for the following services:
- Azure: Application Gateway
- Azure: App Service
- Azure: Container Instances
- Azure: Cosmos DB
- Azure: Event Hubs
- Azure: Files
- Azure: Functions
- Azure: HDInsight
- Azure: Kubernetes Service
- Azure: Load Balancer
- Azure: Cache for Redis
- Azure: Storage Accounts
- Azure: SQL Database
- Azure: SQL Data Warehouse
- Azure: Summary
- Azure: Virtual Machine
- Azure: Virtual Machine Scale Set
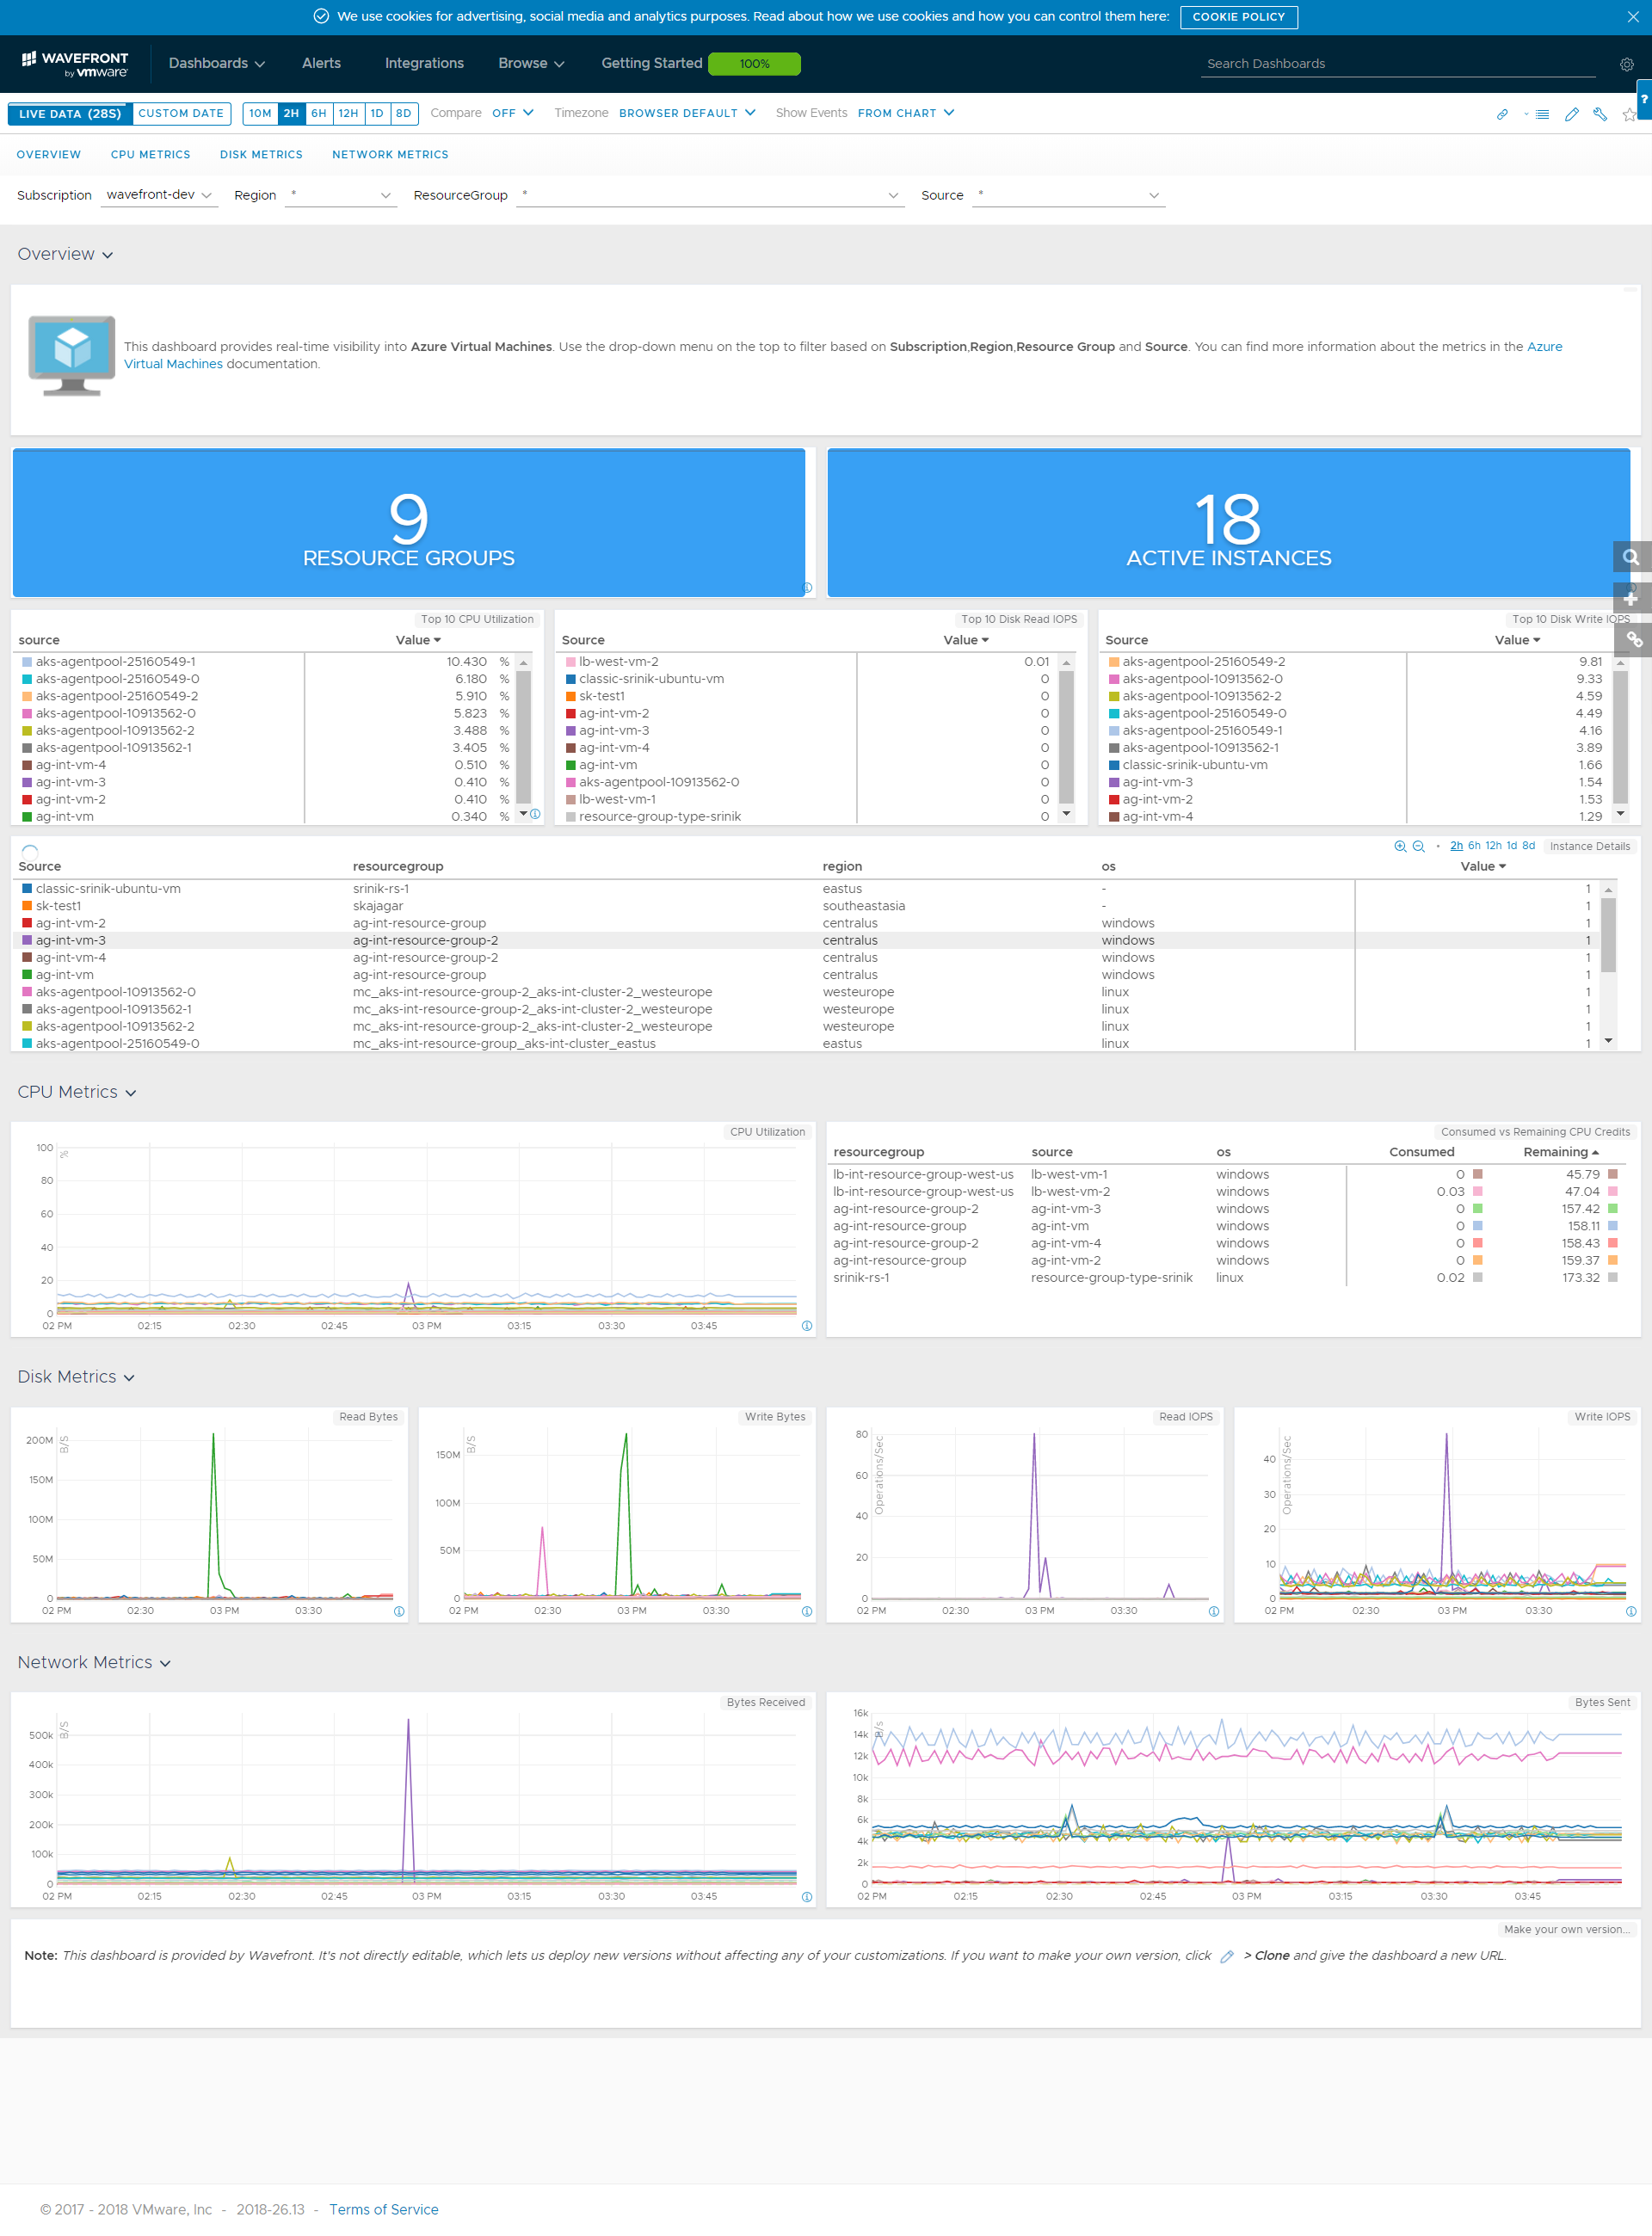
Here’s a preview of the Virtual Machine dashboard:
Metrics Configuration
Tanzu Observability ingests Microsoft Azure metrics using the Azure Monitor APIs. For details on the metrics that the API supports, see the documentation.
Metrics originating from Microsoft Azure are prefixed with azure. within Tanzu Observability. After you set up the integration, you can browse the available metrics in the Metrics browser. Simply click Browse > Metrics from the taskbar and search for azure..
The metric names consist of the actual metric name and a suffix for the aggregation type. The default metric name without a suffix corresponds to the total aggregation type. For example, the metric names for metric azure.compute.vm.percentage.cpu are:
azure.compute.vm.percentage.cpu.average azure.compute.vm.percentage.cpu.maximum azure.compute.vm.percentage.cpu.minimum azure.compute.vm.percentage.cpu.count azure.compute.vm.percentage.cpu (corresponds to azure.compute.vm.percentage.cpu.total)
Metrics Information
You can see the information about the metrics on the Azure metrics doc site. Click a link below to see the detailed metrics information per service:
- Azure Application Gateway
- Azure App Service
- Azure Container Instances
- Azure Cosmos DB
- Azure Event Hubs
- Azure Files
- Azure Functions
- Azure HDInsight
- Azure Kubernetes Service
- Azure Load Balancer
- Azure Cache for Redis
- Azure Storage Accounts
- Azure SQL Database
- Azure SQL Data Warehouse
- Azure Virtual Machine
- Azure Virtual Machine Scale Set
Add a Microsoft Azure Cloud Integration
Adding a Microsoft Azure cloud integration requires establishing a trust relationship between Azure and VMware Aria Operations for Applications (formerly known as Tanzu Observability by Wavefront). The overall process involves the following:
- Getting a Directory ID
- Creating an Azure Active Directory application that represents Operations for Applications inside Azure and getting the Application ID.
- Creating a secret key and getting the Application secret.
To register a Microsoft Azure Cloud Integration:
- In the Name text box, enter a meaningful name.
- In the Directory ID text box, enter your Microsoft Azure Directory ID.
- In the Application ID text box, enter the Azure Active Directory Application (client) ID.
- In the Application Secret text box, enter the secret key that you created. Note: The Azure application secret that you enter is securely stored and never exposed except for read only access to the Azure APIs.
- (Optional) Enter the category names to fetch.
-
(Optional) In the Metric Allow List text box, you can add metrics to an allow list by entering a regular expression. For example,
^azure.(compute|dbforpostgresql).*$.Note: Metric names consist of the actual metric name and a suffix (starting with a dot (“.”)). The suffix represents an aggregation type. In the regular expression, you must use the actual metric names without the aggregation types, such as:
count,average,minimum,maximum,sum, and so on.For example, the metric names for the metric
azure.compute.vm.percentage.cpuare:azure.compute.vm.percentage.cpu.averageazure.compute.vm.percentage.cpu.maximumazure.compute.vm.percentage.cpu.minimumazure.compute.vm.percentage.cpu.countazure.compute.vm.percentage.cpu(corresponds toazure.compute.vm.percentage.cpu.total)
Here, the actual metric name is
azure.compute.vm.percentage.cpu, whileaverage,maximum,minimum, andcountare the aggregation types. When you create the regular expression, you must use onlyazure.compute.vm.percentage.cpu. For example,^azure.compute.vm.percentage.cpu$. - (Optional) Enter the resource group names to fetch.
- Select whether you want to fetch logs. If you decide that you want to fetch activity logs, you can also specify the log categories to fetch, e.g. Administrative, Service health, Alert, and so on.
- Click Register.
Alerts
- Azure Instance CPU Usage Too High:Alert reports when the Azure Instance CPU utilization constantly exceeds the defined limit.
- Azure Disk IOPS Consumed Percentage Too High:Alert reports when the Azure Disk IOPS consumed percentage constantly exceeds the defined limit.
Metrics
| Metric Name | Description |
|---|---|
| azure.storage.storageaccounts.fileservices.availability.* | The percentage of availability for the storage service or the specified API operation. Statistics: average, count, maximum, minimum |
| azure.storage.storageaccounts.fileservices.egress.* | The amount of egress data. Statistics: average, count, maximum, minimum |
| azure.storage.storageaccounts.fileservices.filecapacity.* | The amount of File storage used by the storage account. Statistics: average, count, maximum, minimum |
| azure.storage.storageaccounts.fileservices.filecount.* | The number of files in the storage account. Statistics: average, maximum, minimum |
| azure.storage.storageaccounts.fileservices.filesharecapacityquota.* | The upper limit on the amount of storage that can be used by Azure Files Service in bytes. Statistics: average, count, maximum, minimum |
| azure.storage.storageaccounts.fileservices.filesharecount.* | The number of file shares in the storage account. Statistics: average, count, maximum, minimum |
| azure.storage.storageaccounts.fileservices.filesharesnapshotcount.* | The number of snapshots present on the share in storage account’s Files Service. Statistics: average, maximum, minimum |
| azure.storage.storageaccounts.fileservices.filesharesnapshotsize.* | The amount of storage used by the snapshots in storage account’s File service in bytes. Statistics: average, maximum, minimum |
| azure.storage.storageaccounts.fileservices.ingress.* | The amount of ingress data, in bytes. Statistics: average, count, maximum, minimum |
| azure.storage.storageaccounts.fileservices.successe2elatency.* | The average end-to-end latency of successful requests made to a storage service or the specified API operation, in milliseconds. Statistics: average, count, maximum, minimum |
| azure.storage.storageaccounts.fileservices.successserverlatency.* | The average time used to process a successful request by Azure Storage. Statistics: average, count, maximum, minimum |
| azure.storage.storageaccounts.fileservices.transactions.* | The number of requests made to a storage service or the specified API operation. Statistics: average, count, maximum, minimum |