You can create alerts for your logs data and see the firing events of an alert.
- You need the Logs permission to view the logs alerts.
- You need the Alerts and Logs permissions to create and manage logs alerts.
The steps to add roles and permissions differ for onboarded and original subscriptions. For details, see how to manage roles, groups, and permissions for onboarded subscriptions and original subscriptions.
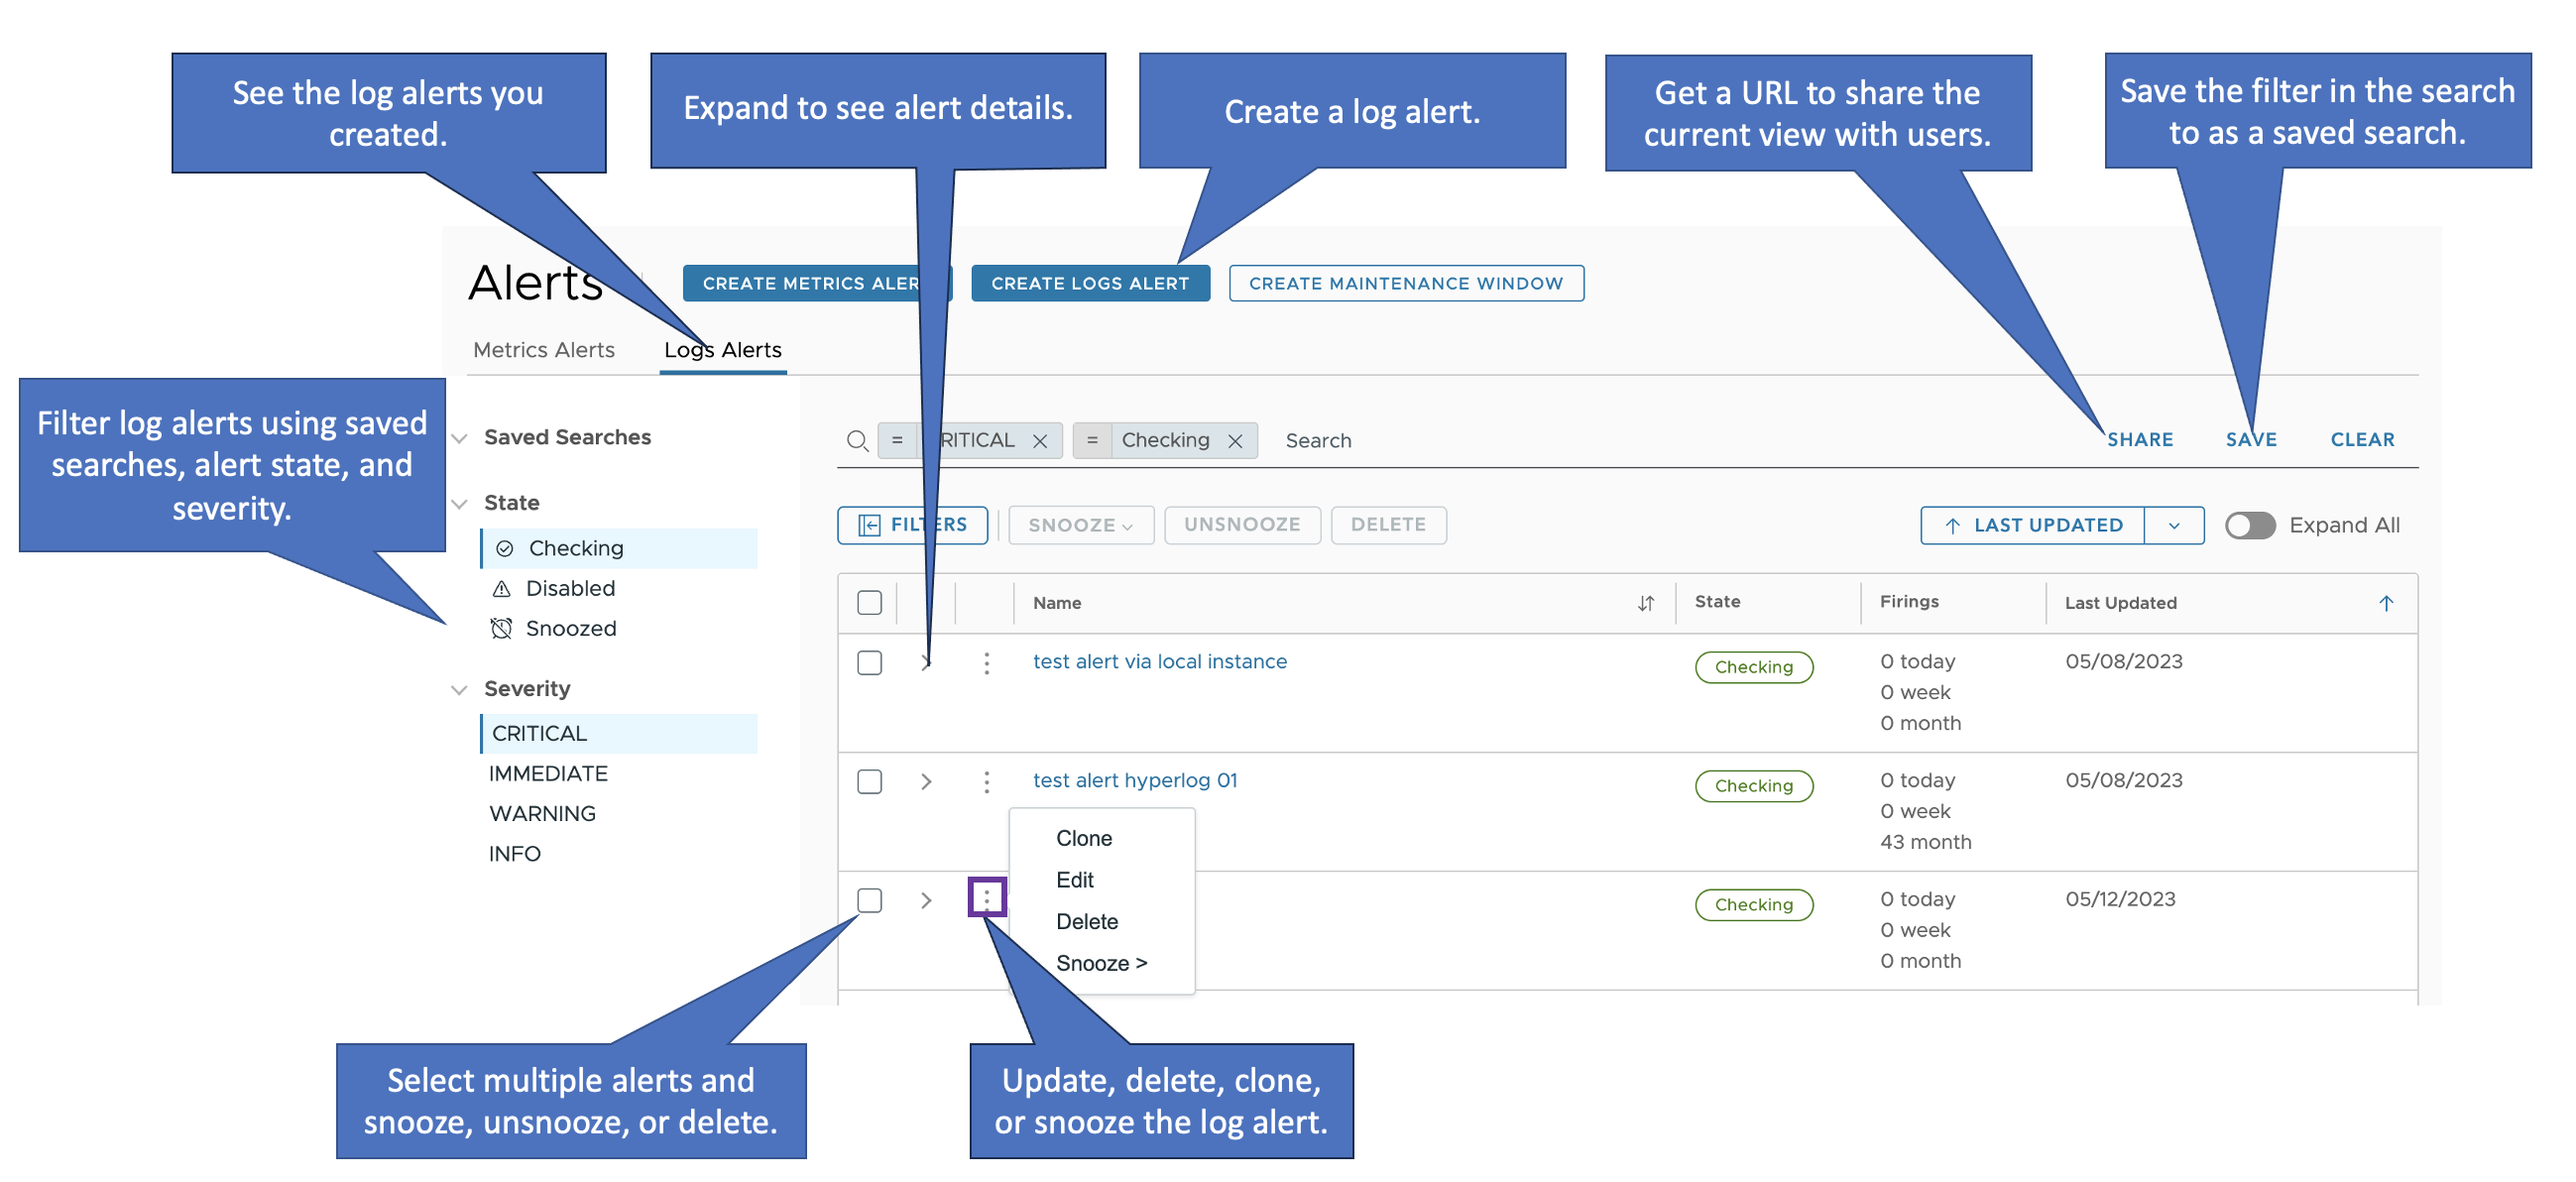
Alerts Browser
Use the Alerts Browser to create and manage your logs alerts. To see the logs alerts you created, click the Logs Alerts tab.
Create a Logs Alert
Follow these steps to create a logs alert:
Go to the Alert Browser
- Log in to your product instance as a user with the Alerts and Logs permissions.
- On the toolbar, click Alerting > All Alerts.
- Click Create Logs Alert.
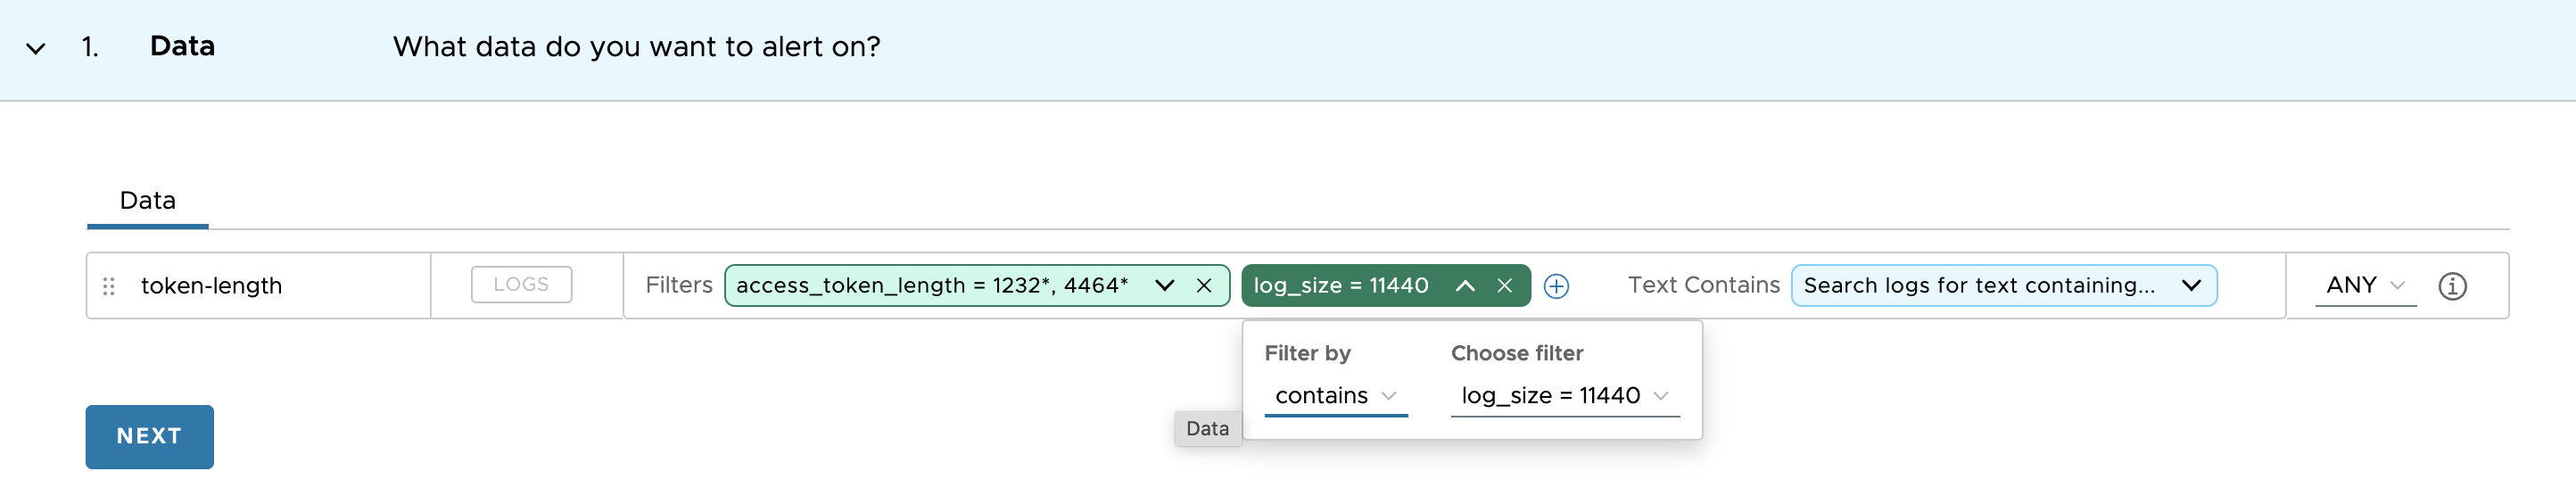
Step 1: Filter the Data
Use the filters to query the logs data:
- Enter a unique name for the query.
- Filter the logs data for which you want to create the alert. There are two types of query filters:
- Use a word or phrase in the log message:
- Next to Text Contains, click Search Logs for Text Containing.
- Enter the text and press Enter.
- To add more filters like this, click the + icon next to the filter.
- Use tags:
- Next to Filters, click Add.
- Select Filter by Operator.
- Click the Choose Filter drop-down menu, select the tag key, and select the tag value.
- To add more filters like this, click the + icon next to the filter.
Settings Description Filters You can use the following filter operators to get the log data and create the alert. If you select more than one value for a filter, the alert fires when any of the specified values in a filter is in a log and when the alert condition is met. - Contains: You get the logs that include the tag values you define.
- Does not contain: You get the logs that don't include the tag values you define.
- Starts with: You get the logs that have tag values that start with the tag value you selected.
- Does not start with: You get the logs that have tag values that don't start with the tag value you selected.
Tags Select a tag key and the corresponding tag values from the drop-down list. The tags you see here are the log attributes you send. See Log Attributes for details.
- Use a word or phrase in the log message:
- If you add more than one Filter by Operator, select one of the following options:
- All: The logs alert you create fires only when all the filters in the query are met.
- Any: The logs alert fires if a filter in the query is met.
- Click Next.
Example:
Get the logs that have any of the following data:
- If the access_token_length value is 4600.
- If the access_token_length value does not start with 1278.
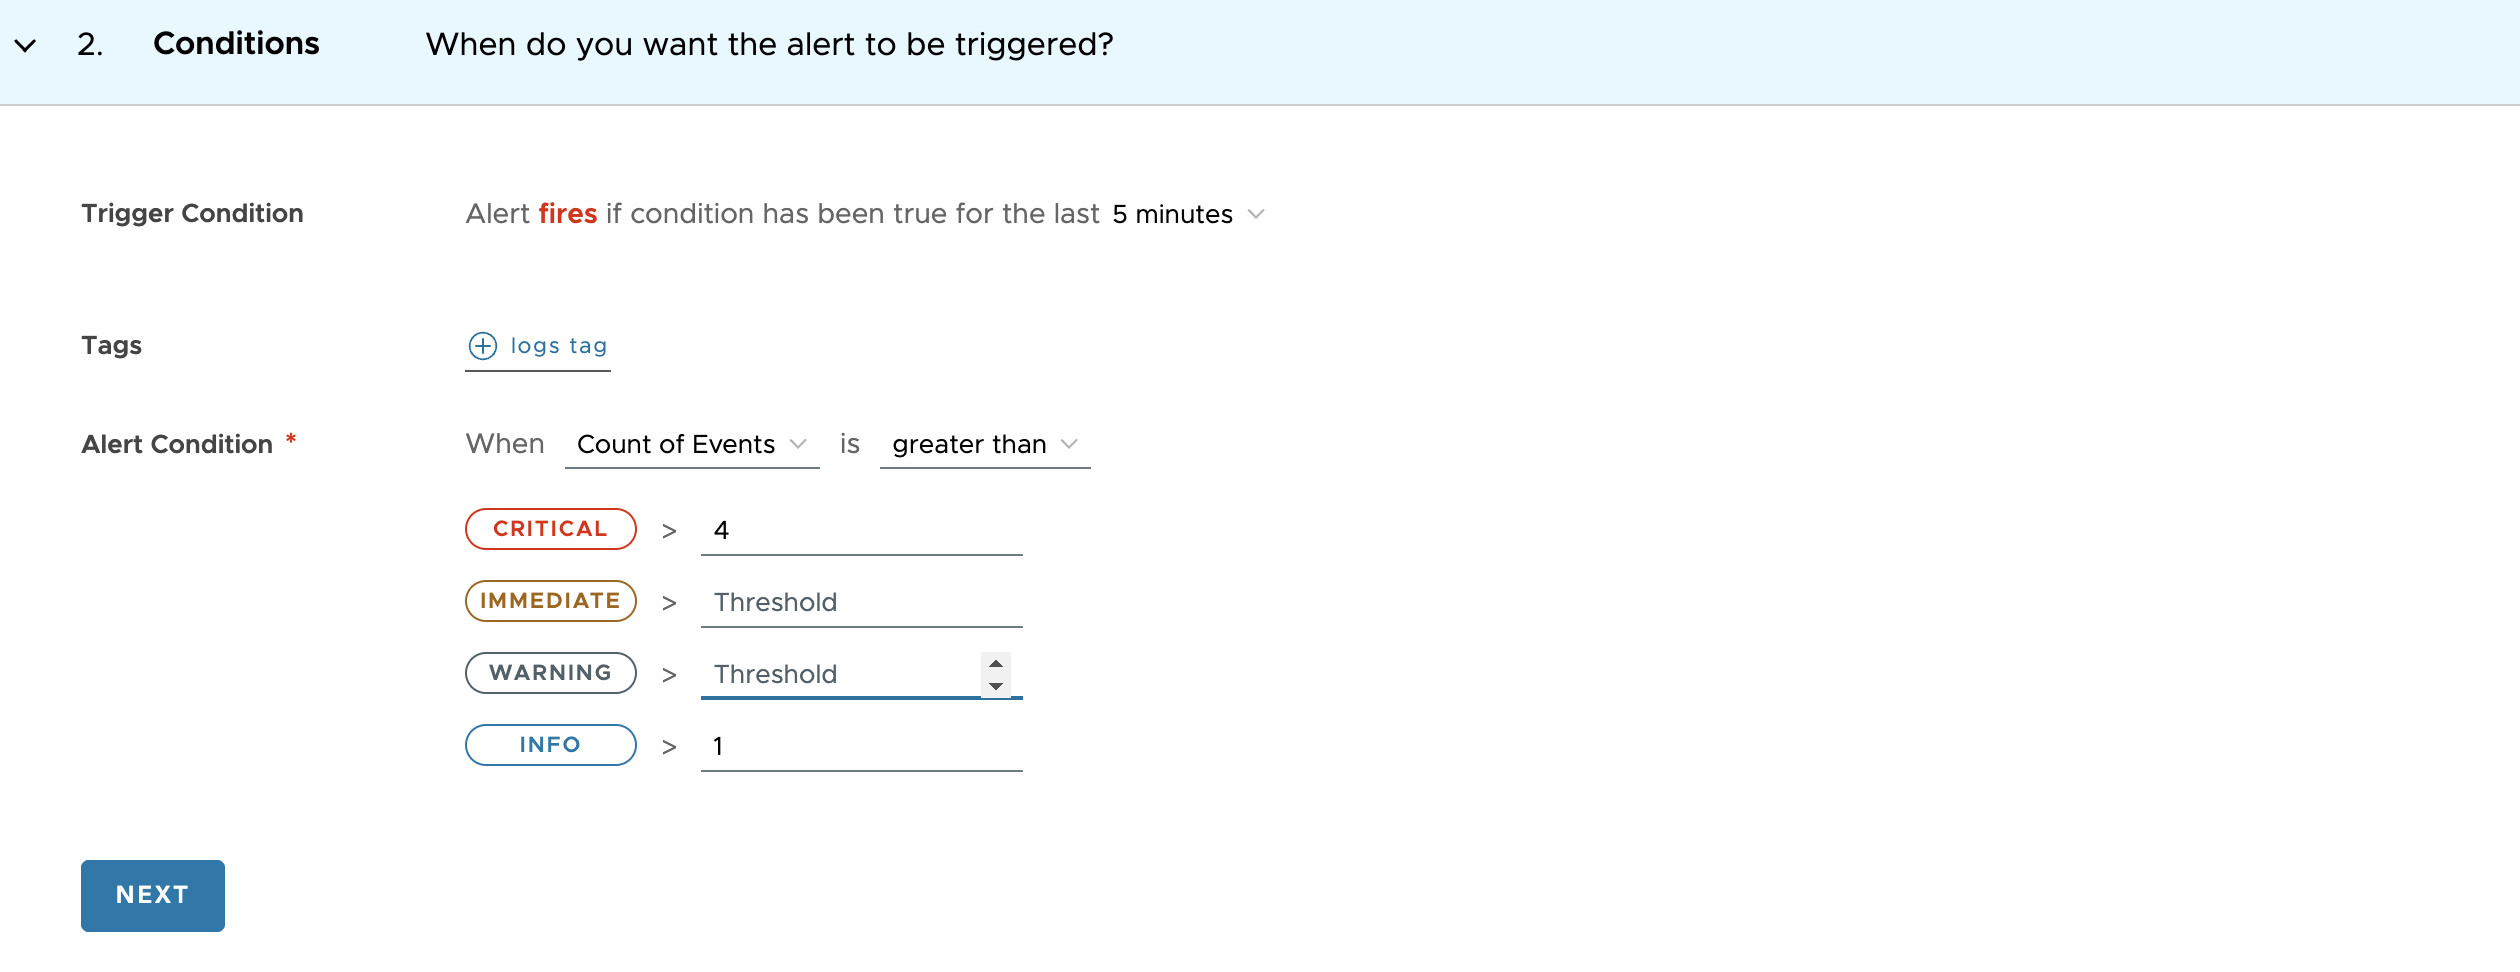
Step 2: Define the Alert Conditions
You can configure the alert to fire in real time, or you can configure the alert to fire when the alert conditions are met for the selected time window.
- Fire alerts in real time, when a log matches the query:
- Click the drop-down menu for Trigger Condition and select Real Time.
- Select the severity for the Alert Condition.
- Click Next.
- Fire alerts when the alert condition is met for a specified time window.
- Click the drop-down menu for Trigger Condition and select a time window. For example, select 5 minutes.
- (Optional) You can group the logs data you see on the chart. For Group By, click + Logs Tag to select a tag and group the logs.
- Define the alert conditions that need to be met for the time window you selected. You must configure a threshold for at least one severity (critical, immediate, warning, or info).
Alert Condition Type Description Count of Events The alert fires when the number of logs for the selected time window is greater than the alert threshold you define. Unique count The alert fires when the number of logs that includes the tag you selected is greater than or less than the alert threshold you define. Average The alert fires when the average number of logs that includes the tag you selected is greater than or less than the alert threshold you define. Maximum The alert fires when the maximum number of logs that includes the tag you selected is greater than or less than the alert threshold you define. Minimum The alert fires when the minimum number of logs that includes the tag you selected is greater than or less than the alert threshold you define. Sum The alert fires when the sum of the logs that includes the tag you selected is greater than or less than the alert threshold you define. - Click Next.
Example: The alert fires if the alert conditions you set are true for 5 minutes:
- Critical state if the number of logs is great than 4.
- Info state if the number of logs is greater than 1.
Step 3: Add a Recipient to the Alert
Email and Webhook notifications are coming soon to Logs Alerts!
Step 4: (Optional) Customize the Alert Firing Message
You can customize the alert firing message and add information to help users understand why the alert fired.
| Settings | Description |
|---|---|
| Recommendations | Add information that is useful to the alert recipient. This field supports Markdown. You can click Preview to preview the Markdown output. |
| Notification Metadata | Add key-value pairs to send additional information in the logs alert firing message. |
After you customize the message, click Next.
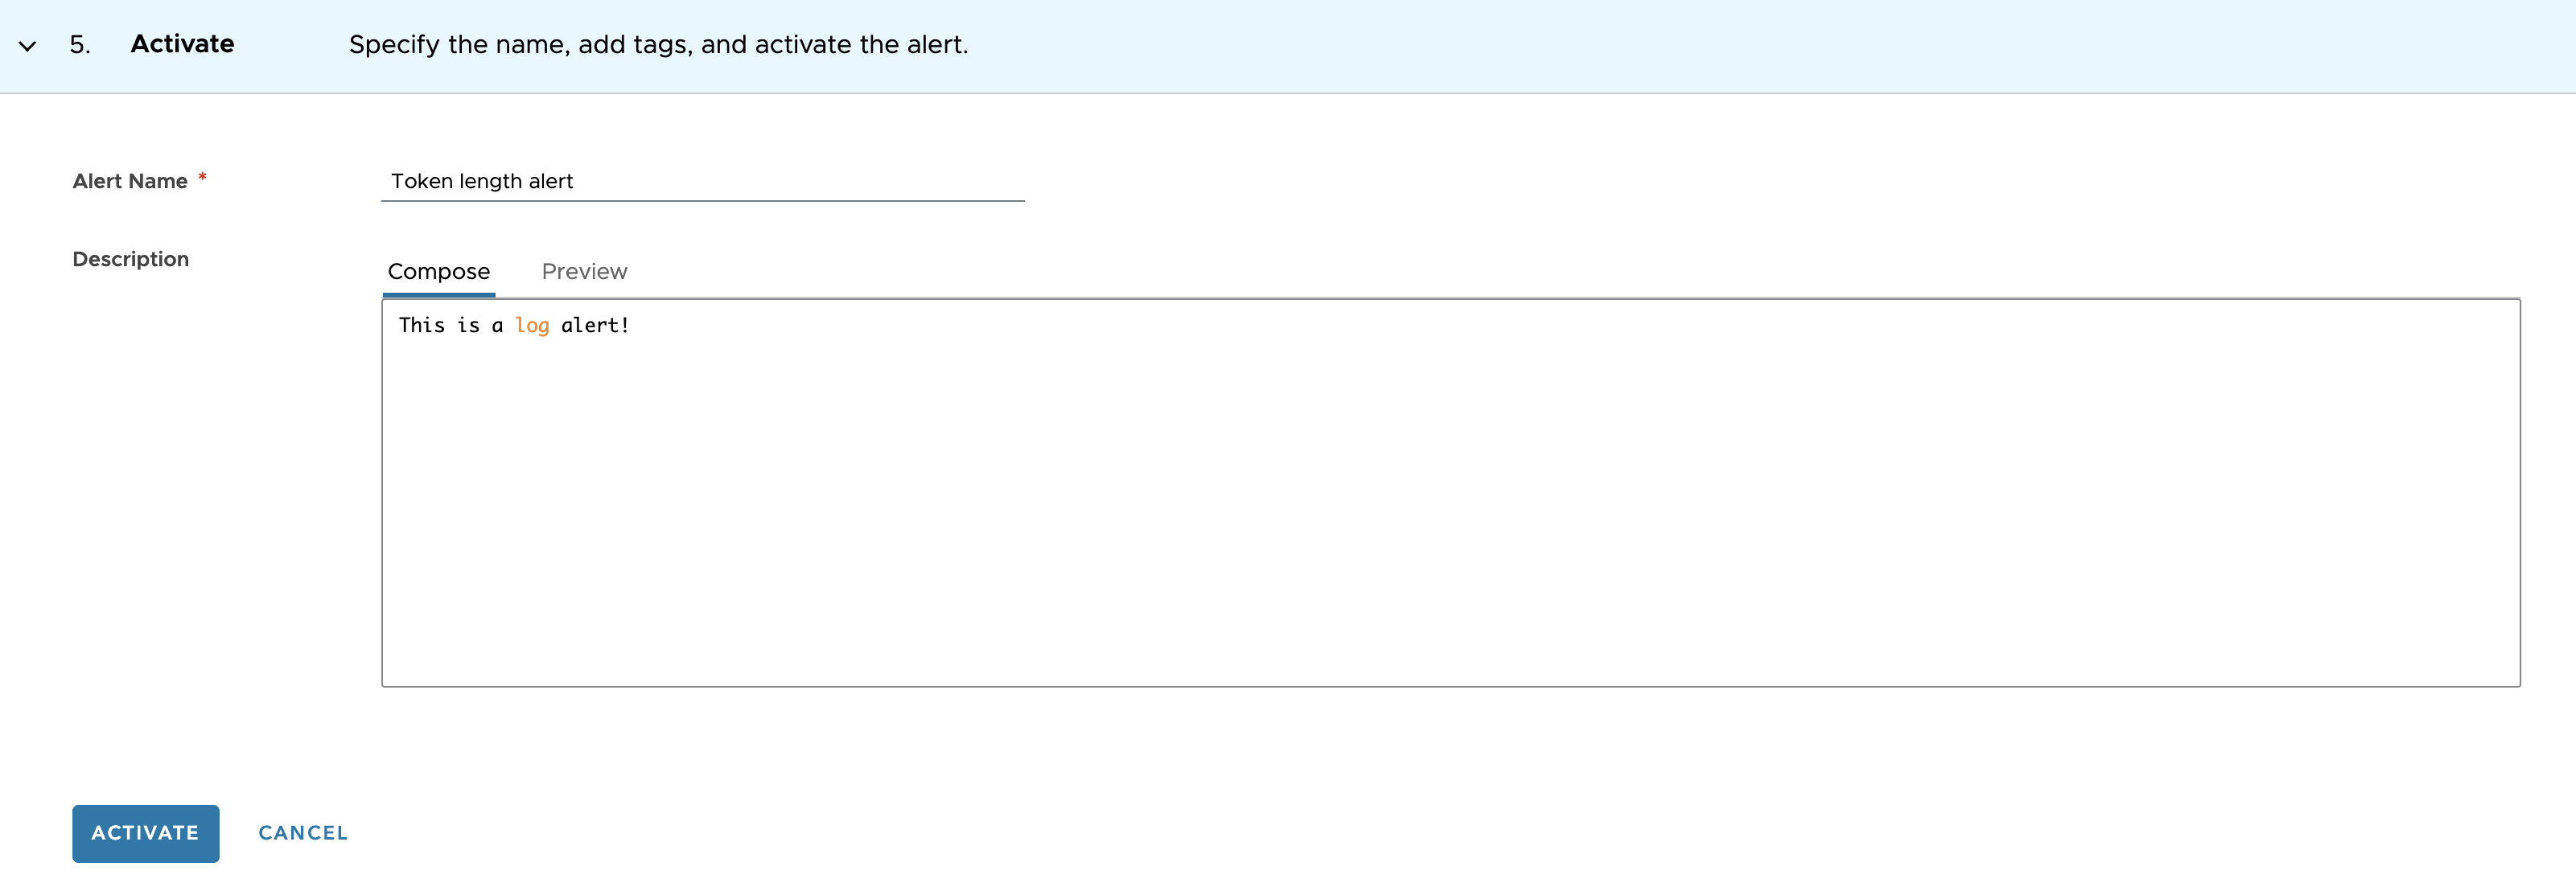
Step 5: Name and Activate the Logs Alert
- Enter the Alert name.
- (Optional) Add a Description to your logs alert. This field supports Markdown. You can click Preview to preview the Markdown output.
- Click Activate to create the alert.
Example:
Once the logs alert is successfully created, you are redirected back to the Alerts Browser page. To see the logs alert you created, search for your alert, and see the status and firing details of the alert.
See Logs Alerts that Fired
Follow these steps to see the firings of a logs alert. You see up to five firing events in the last thirty days.
- On the Alerts Browser, click the Logs Alerts tab.
- Search for the alert you want to edit. You can search for the alert by name, status, severity, or a saved search.
- Click the alert name.
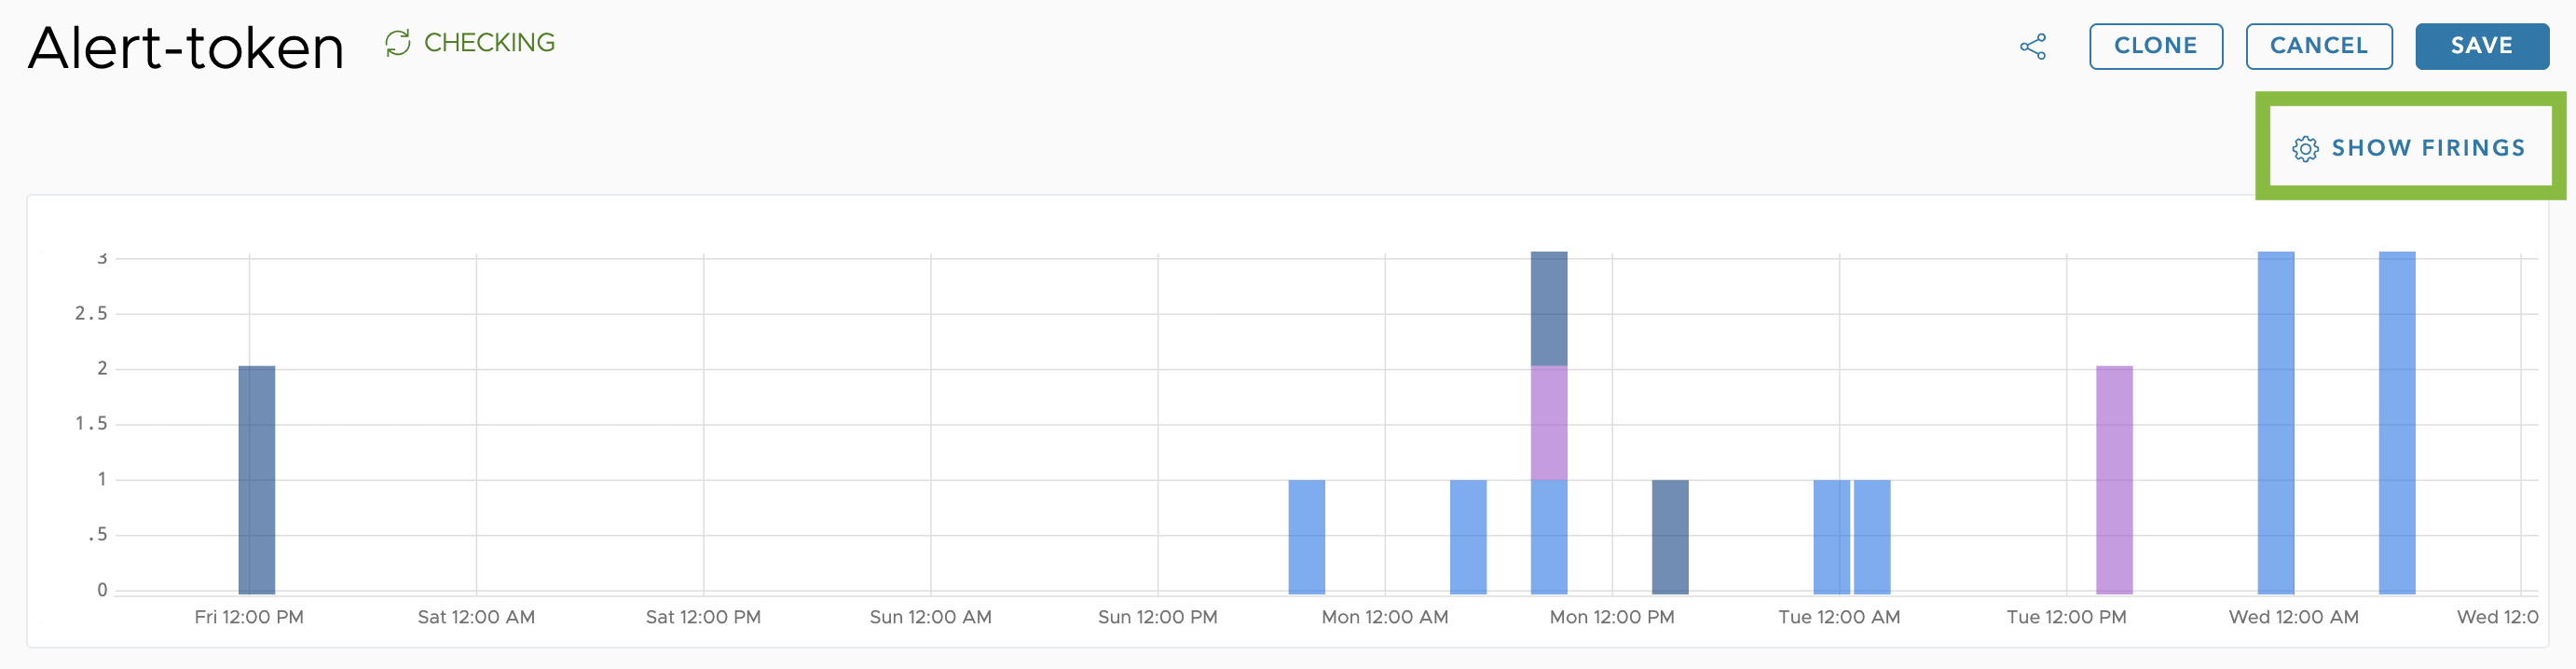
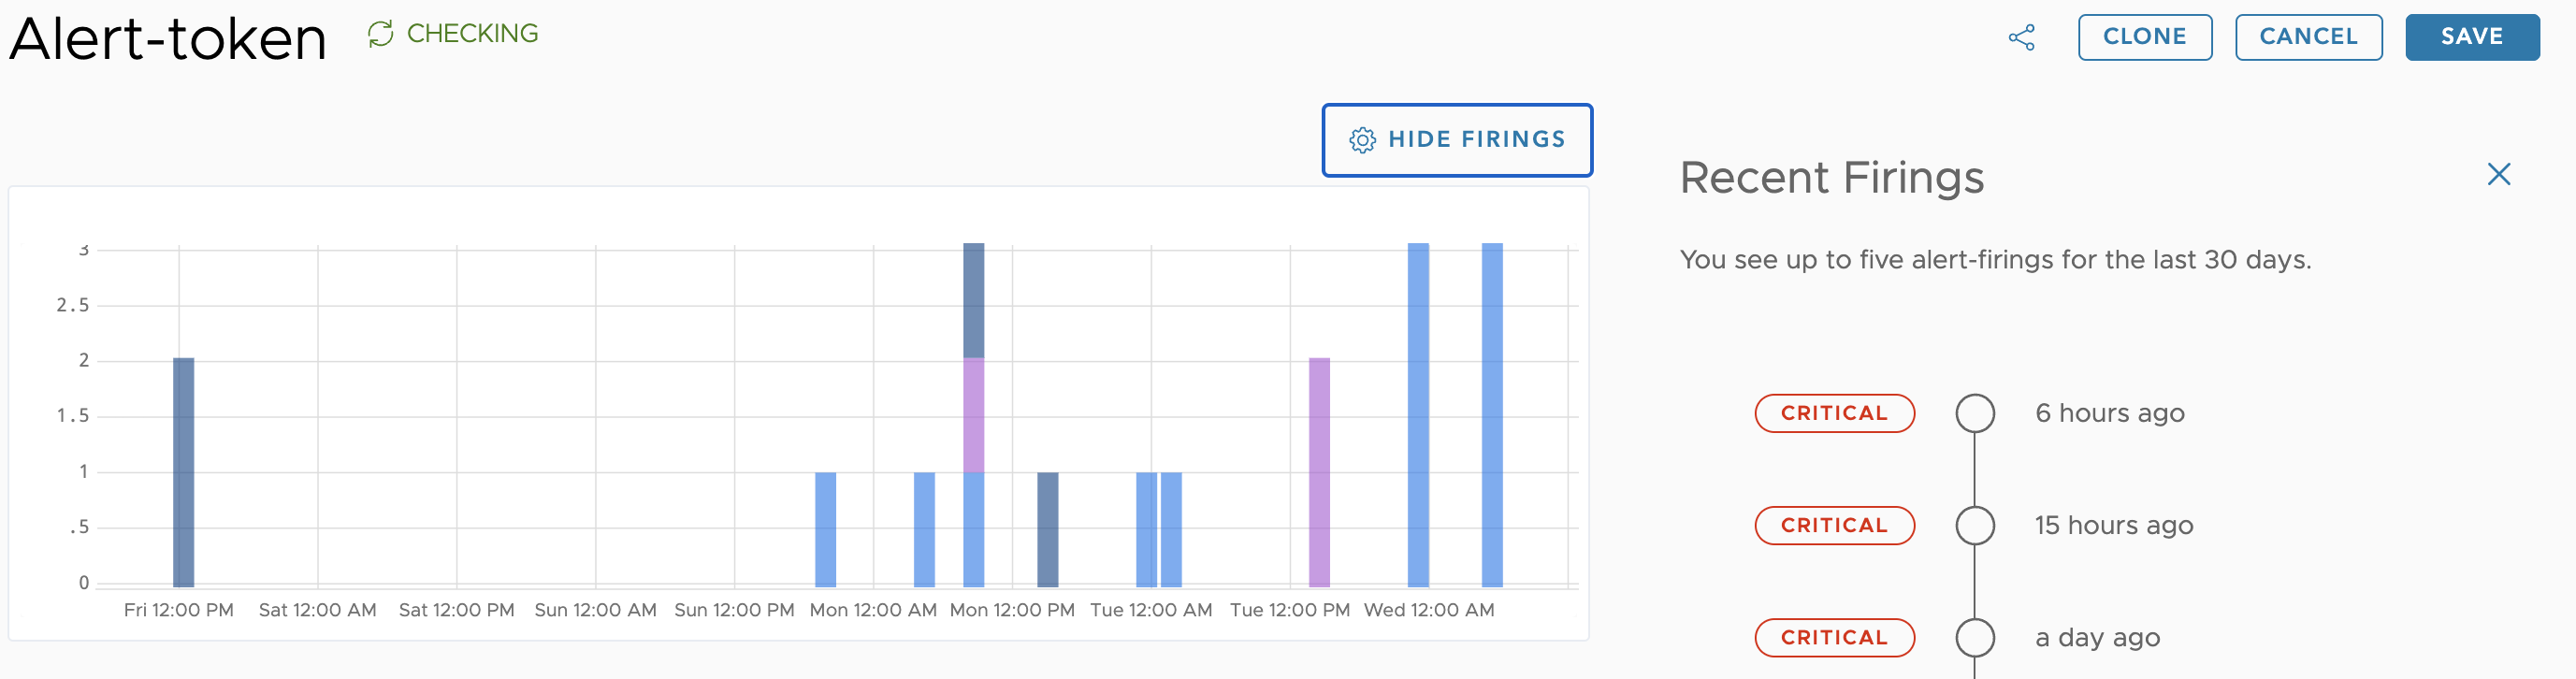
- Click Show Firings at any time to see when the alert fired and fine-tune the behavior based on that information.
The Recent Firings pane shows the last five firing events in the last thirty days. Don’t see any data? That is because the logs alert did not fire in the last thirty days.
Example:
Edit a Logs Alert
Users with the Alerts and Logs permissions can update a logs alert at any time. Follow these steps to update the logs alert.
- On the Alerts Browser, click the Logs Alerts tab.
- Search for the alert you want to edit. You can search for the alert by name, status, severity, or a saved search.
- Click the alert name.
- Click on the section you want to make changes.
- Once all the changes are made, click Save in the top right.
Snooze and Unsnooze a Logs Alert
Snooze a Logs Alert
If you are running tests and don’t want a logs alert to fire, follow these steps to pause the logs alert from firing for a specified time window:
- On the Alerts Browser, click the Logs Alerts tab.
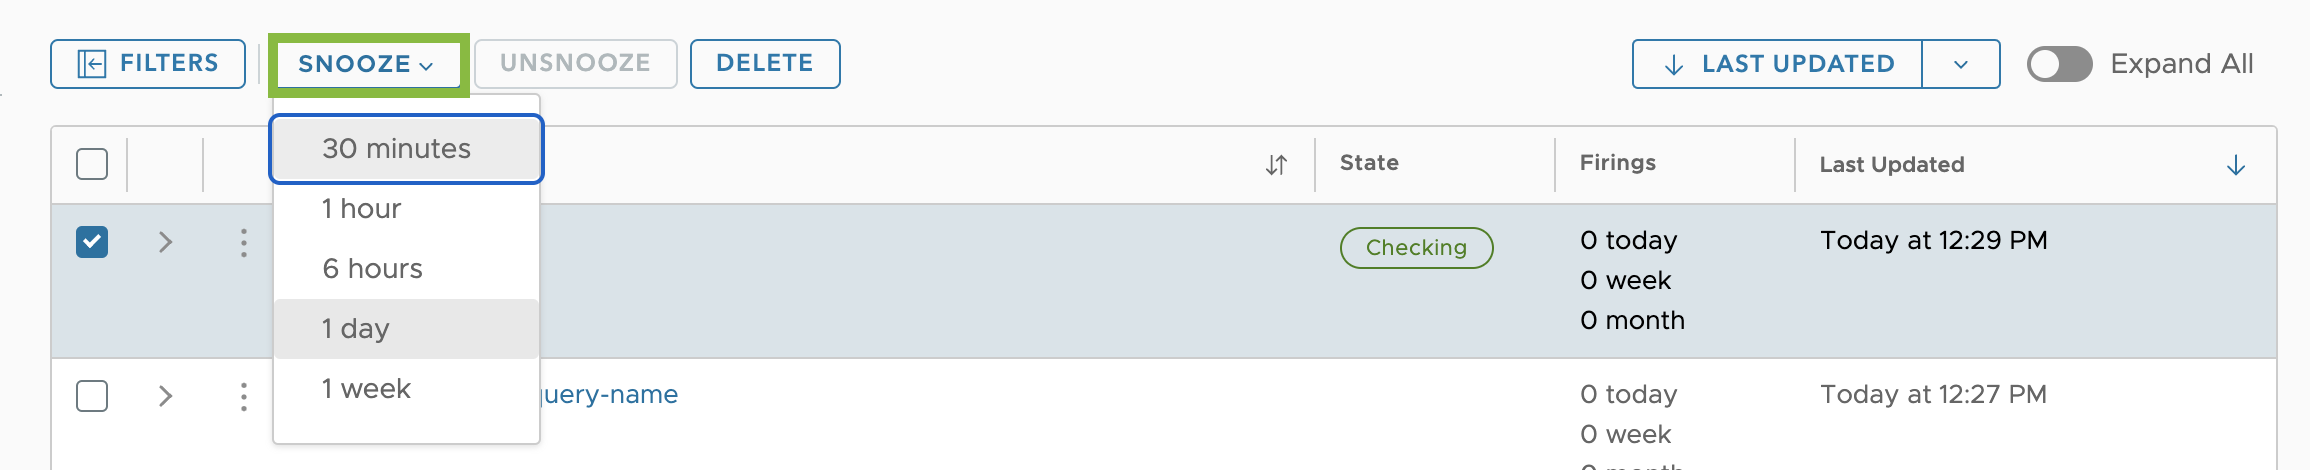
- Select the check box next to the logs alert. You can select more than one logs alert.
- Click Snooze and select how long you want to snooze the alert.
Unsnooze a Logs Alert
Follow these steps once you are done with your testing, and you want a logs alert to fire if the conditions in the logs alert is met.
- On the Alerts Browser, click the Logs Alerts tab.
- Filter the logs alerts you snoozed using the Snoozed Status.
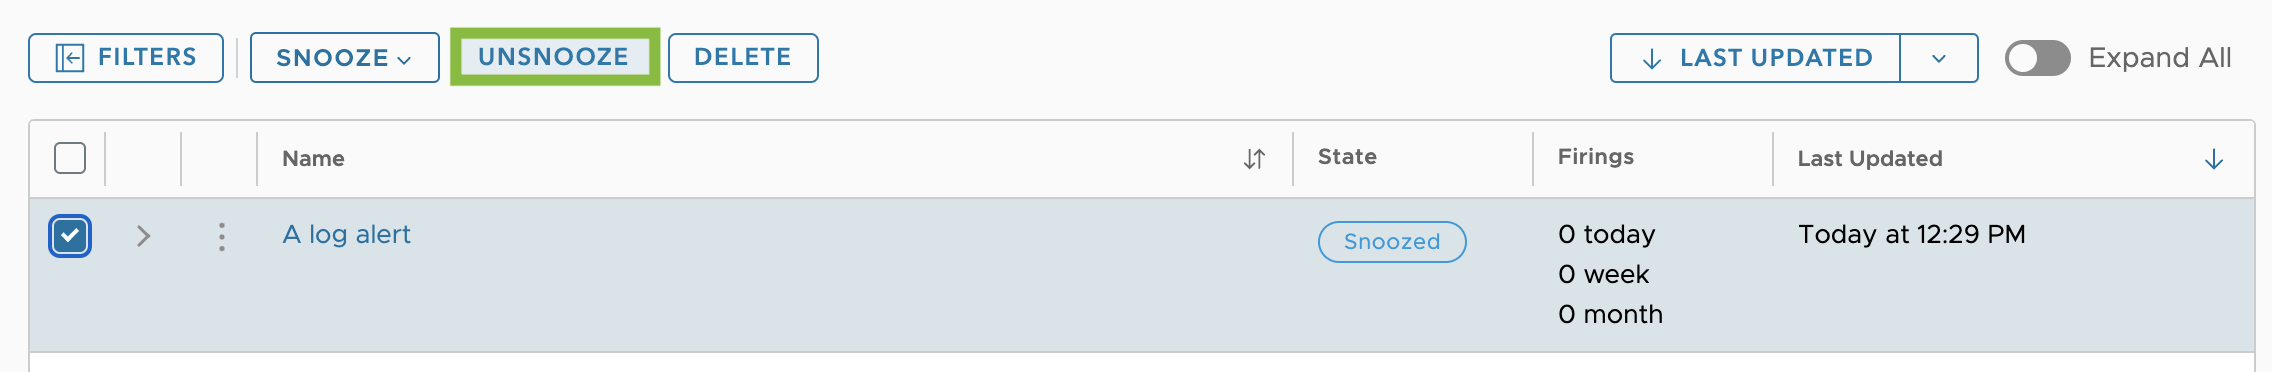
- Select the check box next to the logs alert. You can select more than one logs alert.
- Click Unsnooze. The logs alert changes to the Checking state.
Delete a Logs Alert
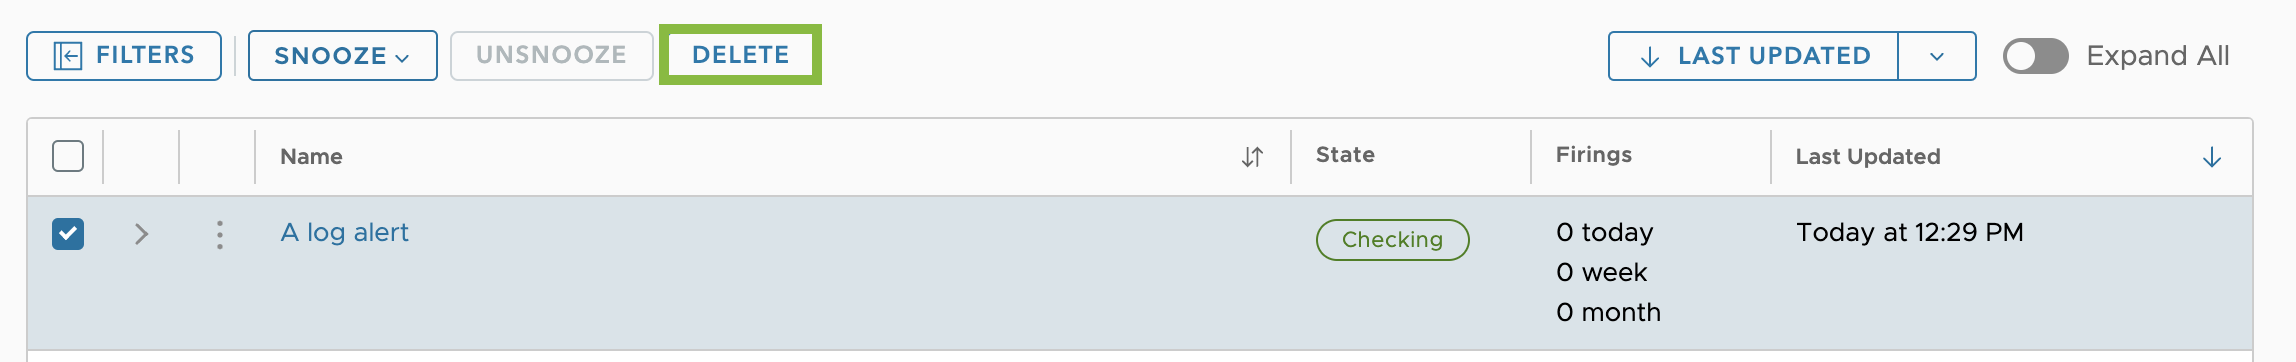
Follow these steps to delete a logs alert you no longer need:
- On the Alerts Browser, click the Logs Alerts tab.
- Select the check box next to the logs alert. You can select more than one logs alert.
- Click Delete. Once deleted you don’t see the logs alert.
Logs Alert FAQs
What are the logs alert limits?
Tanzu Observability uses VMware Aria Operations for Logs (SaaS). See the limitations listed on the Operations for logs documentation (scroll to Limits) when creating and managing logs alerts.