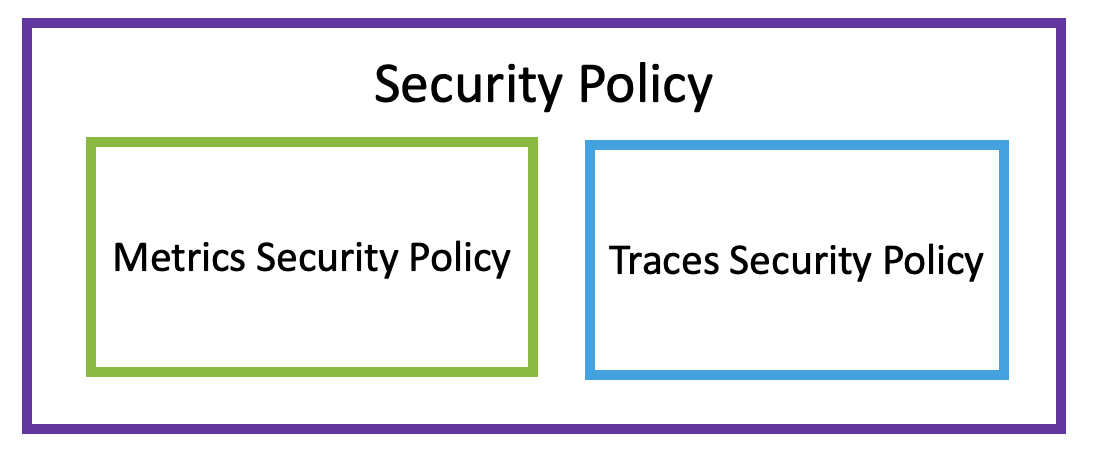
You can create security policies in Tanzu Observability to protect your metrics and traces security data.
In a large enterprise, certain data is confidential. Our service allows you to limit who can see or modify data in several ways.
- Permissions are global settings.
- Some permissions limit who can modify objects (e.g., proxies or events). For example, users with the Dashboards permission can modify all dashboards.
- Other permissions make certain information completely invisible. For example, only users with the SAML IdP Admin permission can see the Self Service SAML menu or access that page.
- Access Control allows administrators with the right permissions fine-grained control over individual dashboards or alerts. For example, it’s possible to limit view and modify access to a Finance_2020 dashboard to just the Finance department.
- Metrics Security supports even finer-grained control. In the example above, access to the Finance_2020 dashboard is limited to the Finance department. With metrics security, you can limit access to confidential time series, histogram, and delta counter metrics to the leadership team.
- Traces Security supports finer-grained control and limit access to confidential trace data from applications or services.
Block or Allow Access to Sensitive Data
With a security policy, you can block or allow access:
- To metrics, optionally filtered by source or point tag.
- To traces, optionally filtered by source or point tag.
- Based on groups, and individual users.
When an account attempts to access metrics or traces, the backend looks at the rules in priority order. Higher priority rules overwrite lower priority rules.
Metrics
For example, assume you have two metrics security rules:
| Name | Priority | Metrics | Accounts |
|---|---|---|---|
| BlockRevenueNumbers | 2 | All metrics that start with revenue* |
All accounts |
| AllowRevenueFinance | 1 | All metrics that start with revenue* |
All accounts in the Finance group |
After the rules are in force, only users in the Finance group can access data that starts with revenue*.
Traces
For example, assume you have two traces security rules:
| Name | Priority | Traces | Accounts |
|---|---|---|---|
| BlockPaymentService | 2 | All spans that include the myapp.payment.* data. |
All accounts |
| AllowPaymentData | 1 | All spans that include the myapp.payment.* data. |
All accounts in Finance group |
After the rules are in force, only the users in the Finance group can:
- See the payment service on the Application Status page.
- See the RED metrics for the Payment service on the Operations Dashboard.
- See the trace data that includes the payments service on the Traces Browser.
 |
Rule Priority and Rule Pairs
Rules are evaluated in priority order. In many cases, it’s useful to think of pairs of rules, for example:
- Create a rule that blocks access to all metrics for a user group. For example, Block all. This rule is with lower priority.
- Create another rule to allow access to a small set of metrics for that user group. E.g., metrics starting with the
cpu.*prefix and that are tagged withenv=dev, i.e. developers environment. For example, Allow CPU metrics. This rule is with higher priority.
| Name | Priority | Metrics |
|---|---|---|
| Allow metrics | 1 | Allow access to metrics starting with the cpu.* prefix and with point tag env=dev. |
| Block all | 2 | Block all metrics |
When you apply this policy, the users included in the user group will have access to the metrics starting with the cpu. prefix and point tag env=dev, because the Allow metrics rule overrides the Block all rule.
|
Metrics Security Policy
You can block sensitive metrics data from time series, histograms, RED metrics, and delta counters so that they don’t show on charts and dashboards, and alerts.
Video: Metrics Security Policy
Watch this video for an overview. Note that this video was created in 2020 and some of the information in it might have changed. It also uses the 2020 version of the UI.
Sensitive Data Becomes Invisible
Data protected by a metrics security policy rule can become invisible to users.
- Not visible in charts. The chart either includes a warning that some metrics are protected, or, if all metrics are protected, the chart shows only the message.
- Not visible in alerts (if Secure Metrics Details is selected for the alert). The alert fires based on the complete set of metrics, and the complete set is shown in notification images by default. A check box allows administrators to hide alert details so that confidential metrics are not shown.
- Not visible in auto-complete in Chart Builder, Query Editor, Metrics browser, etc.
Alert Notifications
To protect metrics or RED metrics from inclusion in alert notifications, use the Secure Metrics Details check box. Tanzu Observability looks at all metrics when determining when an alert status should change and shows them in alert notifications. When the check box is selected, details are not shown in the notification.
Derived Metrics and Events
The current implementation has limitations:
- Does not protect metrics in events.
- Does not protect metrics in the Derived Metrics browser. When you select Browse > Derived Metrics, you still see metrics on that page even if a metrics security policy rule blocks access for you elsewhere in the GUI.
Warning Messages for Protected Metrics
- Charts in Dashboard. If certain charts in a dashboard include protected metrics, those charts display that information, as follows:
- Some metrics protected. If some metrics in a chart are protected, the chart shows metrics but includes the following Warning message.
Some metrics returned by this query might be excluded due to metrics security policy rules. - All metrics protected. If all metrics in a chart are protected, the chart shows only the following message:
All metrics in this chart are excluded due to metrics security policy rules.
- Some metrics protected. If some metrics in a chart are protected, the chart shows metrics but includes the following Warning message.
-
Chart in Edit Mode. When you edit a chart and your query result include protected metrics, the following message is displayed below the query.
All metrics returned by this query are excluded due to metrics security policy rules.
Create a Metrics Security Policy Rule
Privileged users can create rules, change rule priority, and change the scope of each rule.
Plan Your Strategy
Before you create rules, plan your strategy.
- Metrics Dimensions allow you to determine what to block or allow.
- Specify one or more metric prefixes. You can specify an exact match (e.g.,
requestsorrequest.) or a wildcard match (e.g.*.cpu.loadavg.*,cpu.*). - Specify a combination of metric sources or point tags to narrow down the metrics. For example, you can block visibility into production environments for some developers, or you can block some development environments metrics for contractors.
- Specify one or more metric prefixes. You can specify an exact match (e.g.,
- Access allows you to allow or block access for a combination of accounts or groups.
See the Examples further below.
Create One or More Rules
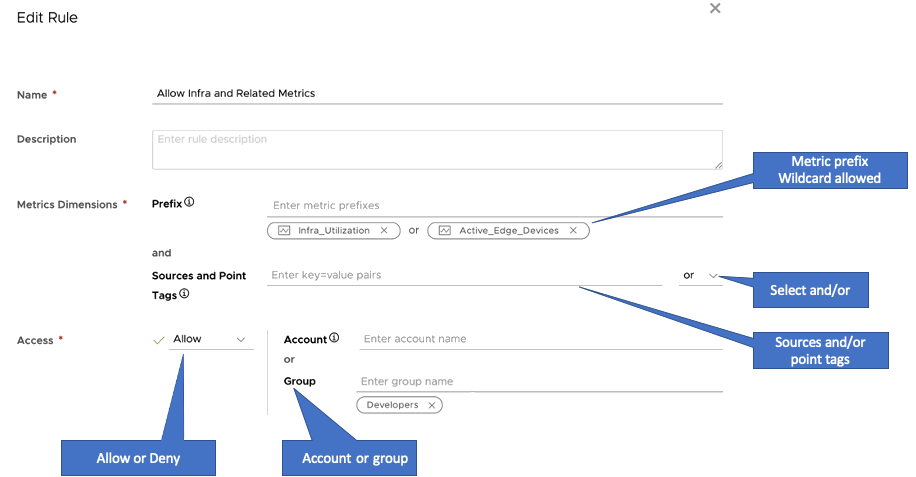
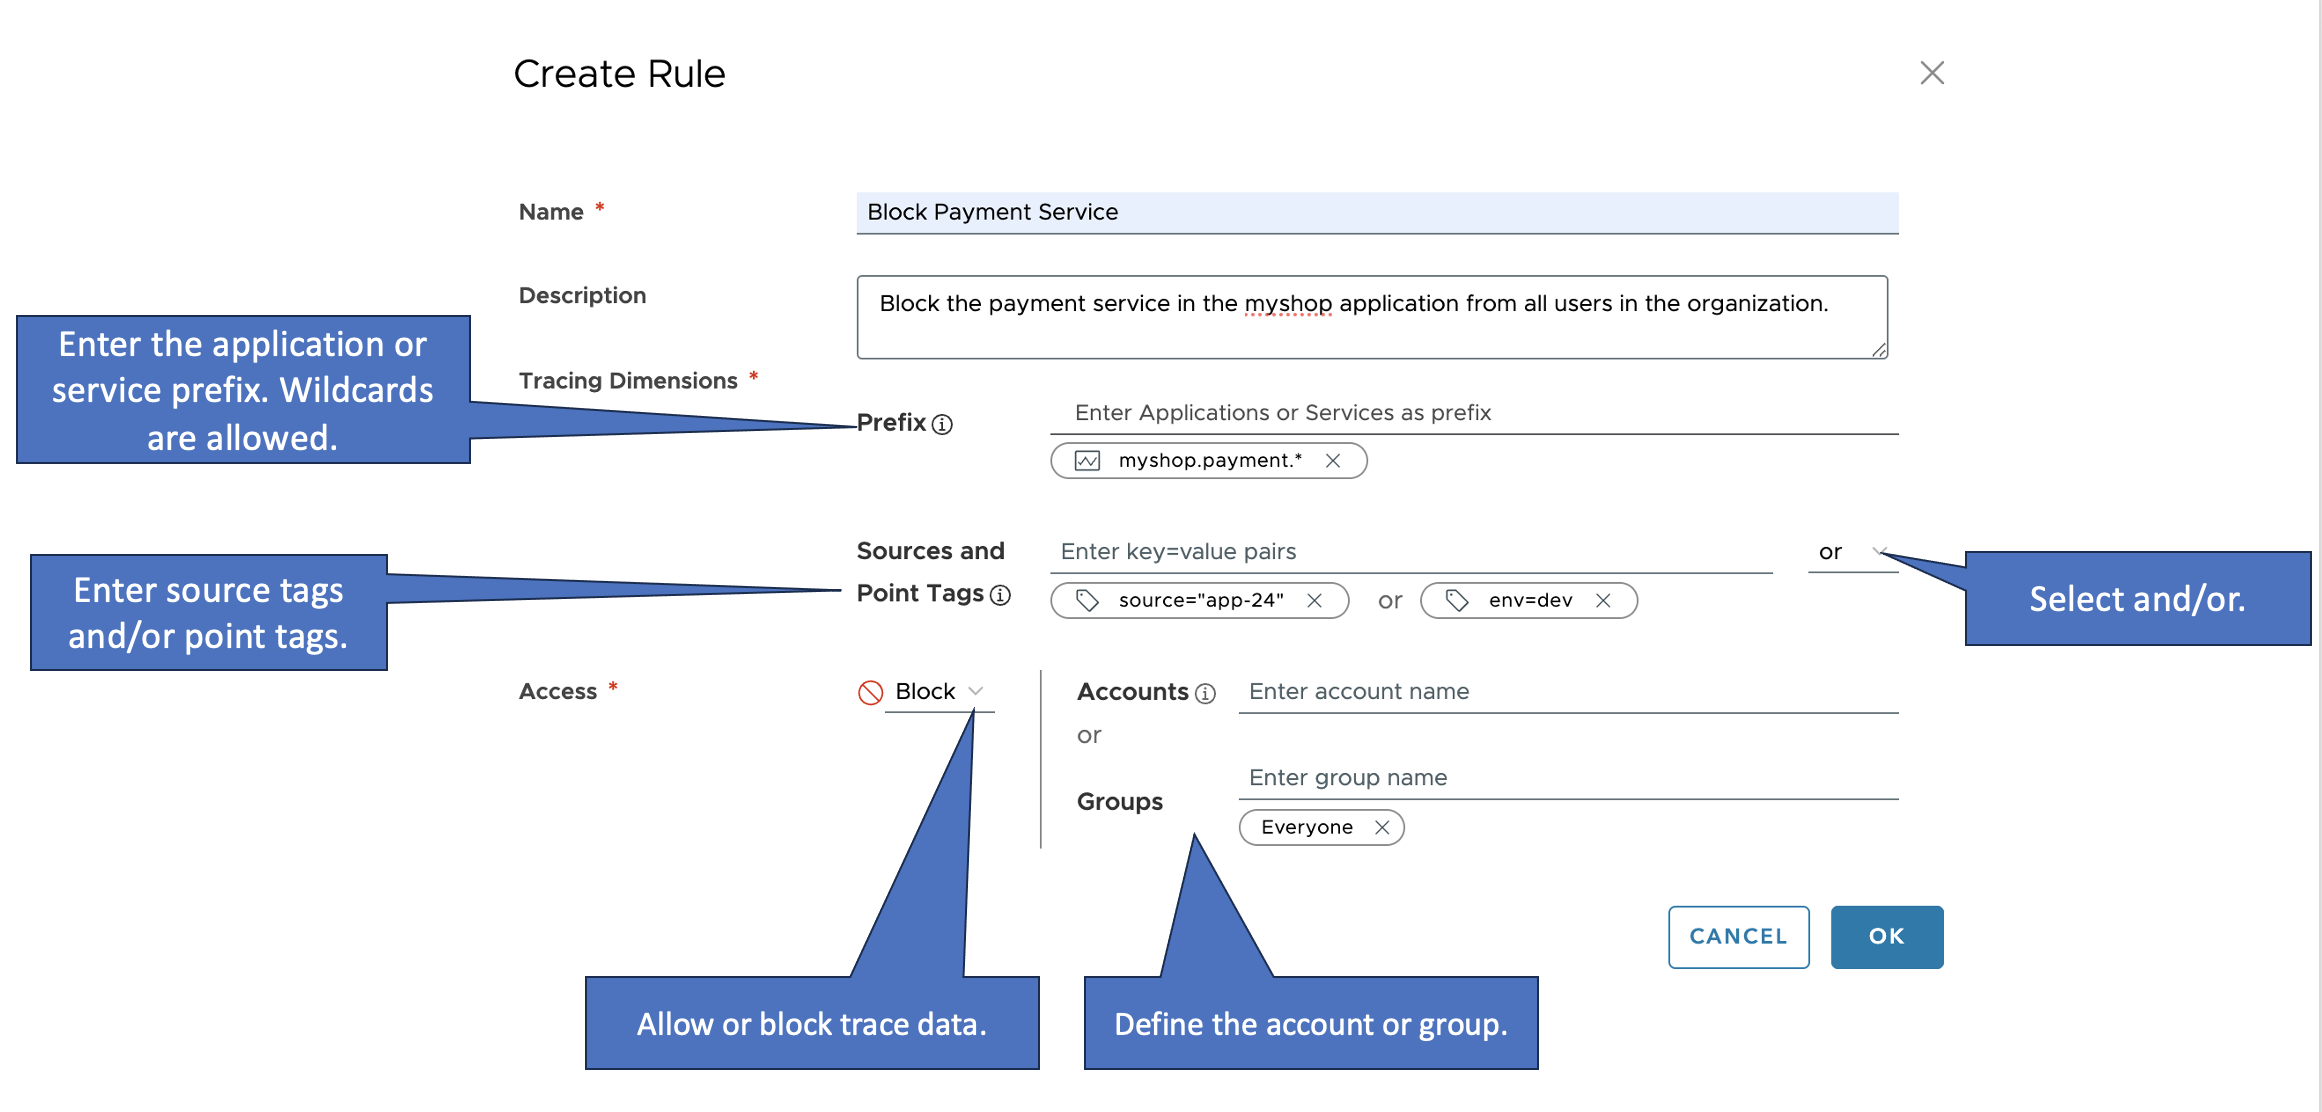
You create a metrics security policy rule following these steps. See the annotated screenshot below for an example.
- From the gear icon on the toolbar, select Security Policy and click Create Rule.
- Make sure you are on the Metrics Security Policy tab.
- Click Create Rule.
-
Specify a meaningful name and, optionally, a description.
Users might later modify the rule, so a clear name is essential. The description is visible only when you edit the rule. The name is visible on the Metrics Security Policy page.
- Specify and describe the metrics:
- You can specify the full metric name or use a wildcard character in metric names, sources, or point tags. The wildcard character alone (
*) means all metrics. - Specify key=value pairs, for example,
source="app-24"orenv=dev. - If you want to specify multiple key=value pairs, select whether you want to combine them with
andororusing the dropdown menu on the right.
- You can specify the full metric name or use a wildcard character in metric names, sources, or point tags. The wildcard character alone (
- Specify the Access definition for the rule.
- Select Allow or Block from the menu.
- Specify accounts, or groups.
- Click OK.
Here’s an annotated screenshot that shows the main actions:
Examples for Metrics Security Policies
Before you start, plan your strategy. Here are some common scenarios.
Example: Restrict Access to Confidential Metrics
This example restricts access to specific ranges of highly-sensitive metrics, say revenue numbers, to the specified groups of users.
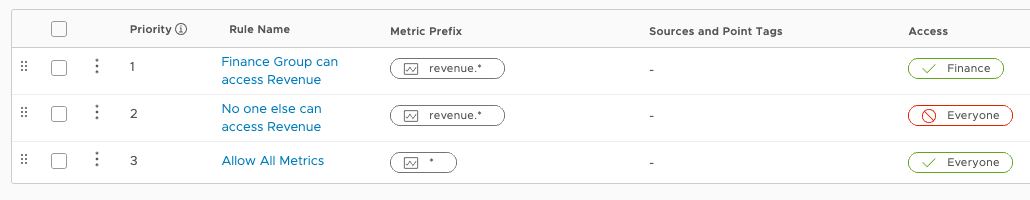
The image above shows how to restrict metrics starting with revenue.* to be accessible only by members of the group Finance. The policy grants all users access to all other metrics.
-
When the metric
revenue.saasis queried by a user in theFinancegroup, this access matches Rule 1 (Finance Group can access Revenue). The rule grants the access, so the metric is shown to the user and no other rules are consulted. -
When the metric
revenue.saasis queried by a user not in theFinancegroup, the access does not match Rule 1. The engine moves on to Rule 2 (No one else can access Revenue), which matches because all users belong to the Everyone group. Because the rule denies the access, the metric is not shown to the user. No other rules are consulted.
Example: Restrict Access for a Group of Users
This example restricts access for a group of users, making only a subset of the metrics in the system available to them.
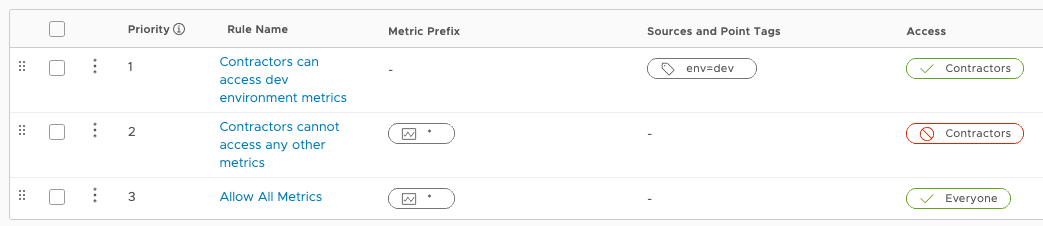
The image above shows how to restricts access for users in the group Contractors. Those users can only query metrics tagged with the point tag env=dev. This policy imposes no restrictions on any other groups.
- When a user belonging to group
Contractorsruns a query forcpu.usagetagged withenv=dev, this access matches Rule 1 (Contractors can access dev environment metrics) and access is granted. - But when the user issues a query for
cpu.usagetagged withenv=prod, this access does not match Rule 1. Rule 2 (Contractors cannot access any other metrics) acts as a catch-all for users of groupContractorsand denies them access to this metric.
Example: Restrict Access to All Except Specific Metrics
This example restricts access to all metrics except for two specific groups of metrics that are additionally narrowed down by specifying tags.
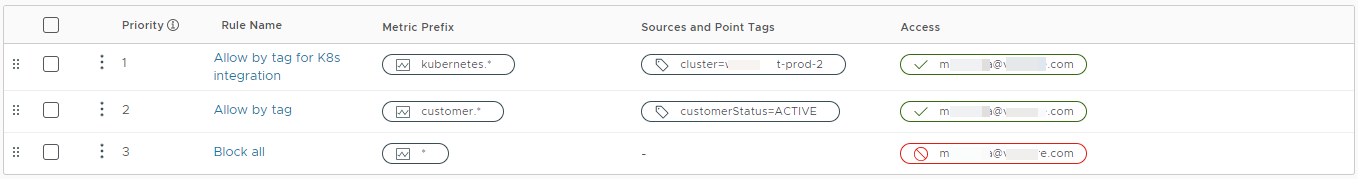
The image above shows how to restrict access for a specific user. The user cannot access any metrics except the ones specified in the first two rules. This Metrics Security Policy can also be applied to a user group.
- Rule 3 (Block all) restricts access to all existing metrics for the user.
- Rule 2 (Allow by tag) provides access to all metrics that start with the prefix
customer.andcustomerStatus=ACTIVEtag. - Rule 1 (Allow by tag for K8s integration) provides access to all metrics with the
kubernetes.prefix for a specific cluster.
When you apply the above security policy, the user CAN see all metrics starting with the customer. and kubernetes. prefixes in the Metrics Browser. Also, the user CAN explore and create charts with the customer.* metrics having the customerStatus=ACTIVE tag and the kubernetes. metrics for the specific cluster. Autocomplete will work of these metrics.
Example: Strictly Limit Access on a Need-to-Know Basis
Some companies want to make metric accessible only to the team that needs to know about it. Access to metrics outside a team’s scope of work is disabled. Only administrators are allowed access to all metrics.
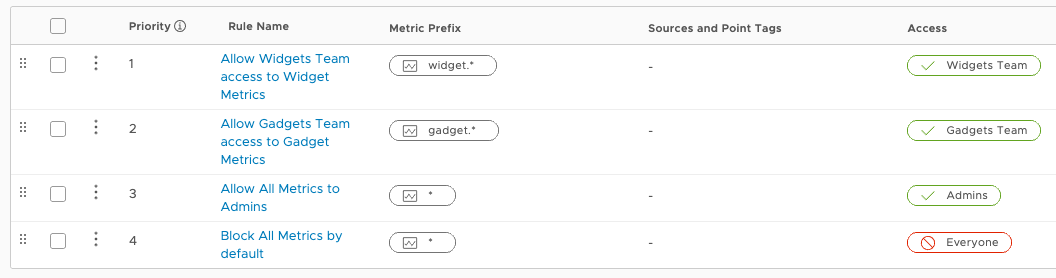
The image above shows how to use a set of rules to accomplish this.
- Rule 4 (Block All Metrics by default) applies to any access that doesn’t match a higher-up rule. It denies access to all users. Users get access only when an “exception” rule with higher priority access matches.
- Rule 3 (Allow All Metrics to Admins) grants access to all metrics to users in the
Adminsgroup. - Rule 2 (Allow Gadgets Team access to Gadget Metrics) grants access to any metrics starting with
gadget.*to members of theGadgetsgroup. - Rule 1 (Allow Widgets Team access to Widget Metrics) grants access to any metrics starting with
widget.*to members of theWidgetsgroup.
In this example, ordering (priority) between rules 1 and 2 does not matter because describe rules for independent metric regions.
With this policy in place:
- Members of the
Widgetsgroup are granted access if the metric starts withwidget.*(Rule 1) and denied otherwise (Rule 4). - Members of the
Gadgetsgroup are granted access if the metric starts withgadget.*(Rule 2) and denied otherwise (Rule 4). - Members of the
Adminsgroup are granted access to all metrics (Rule 3). - Users who don’t belong to the groups covered by the rules have no access.
|
Traces Security Policies
You can block application or service information for specific users so that they don’t see the data on the Application Status page, Traces Browser, Application Map, or Operations Dashboards.
Sensitive Data Become Invisible
Data protected by a traces security policy rule can become invisible to users.
- Not visible on the Traces Browser. If you are blocked from an application or service, you don’t see the respective traces on the Traces Browser.
- Not visible on the Application Status page. You don’t see the services that are blocked on this page for the table, app map, and grid view.
- Not visible on the Service Dashboard. The charts generated on the Service Dashboard do not have any data because the RED metrics related to the application or service are blocked.
Note: Tracing security policies do not apply to Charts and Dashboard variables that use
~component.heartbeat, such as cloned Service Dashboards or Operations Dashboards. - Not visible on the Operation Dashboard. The charts generated on the Operations Dashboard do not have any data because the RED metrics related to the operations of the application or service are blocked.
Note: Tracing security policies do not apply to Charts and Dashboard variables that use
~component.heartbeat, such as cloned Service Dashboards or Operations Dashboards.
Create a Traces Security Policy Rule
You create a traces security policy rule following these steps. See the annotated screenshot below for an example.
- From the gear icon on the toolbar, select Security Policy and click Create Rule.
- Click the Traces Security Policy tab.
- Click Create Rule.
-
Specify a meaningful name and, optionally, a description.
Users might later modify the rule, so a clear name is essential. The description is visible only when you edit the rule. The name is visible on the Security Policy page.
- Specify and describe the application or service:
- You can specify the full application, service, and operation name. You can also use a wildcard character in application name, service names, sources, or point tags. The wildcard character alone (
*) means all traces. - Specify key=value pairs, for example,
source="app-24"orenv=dev. - If you want to specify multiple key=value pairs, select whether you want to combine them with
andororusing the dropdown menu on the right.
For example, assume that you have the following:
- A
supermarketapplication with thevegetablesGreen,vegetablesRed,fruits, anddairyservices. - The
vegetablesGreenservice has theaddandpurchasedoperations. - Another application named
supermarket200.
Tracing Prefix Example Description applicationName*supermarket*Using this prefix format, you can allow or block the trace data of all the applications that start with supermarket. In this example, trace data of thesupermarketandsupermarket200applications and their services can be blocked or shown to specific users.applicationName.*supermarket.*Using this prefix format, you can allow or block the trace data of all the services in the supermarketapplication. It includes thevegetablesGreen,vegetablesRed,fruits, anddairyservices.applicationName.serviceName*supermarket.vegtables*Using this prefix format, you can block or allow the data of all the services that start with vegetables. In this example, the data of thevegetablesGreenandvegetablesRedservices can be blocked or shown to specific users.applicationName.serviceName.*supermarket.vegtablesGreen.*Using this prefix format, you can allow or block the data of the supermarketapplicationsvegtablesGreenservice, which includes theaddandpurchasedoperations. - You can specify the full application, service, and operation name. You can also use a wildcard character in application name, service names, sources, or point tags. The wildcard character alone (
- Specify the Access definition for the rule.
- Select Allow or Block from the menu.
- Specify accounts or groups.
- Click OK.
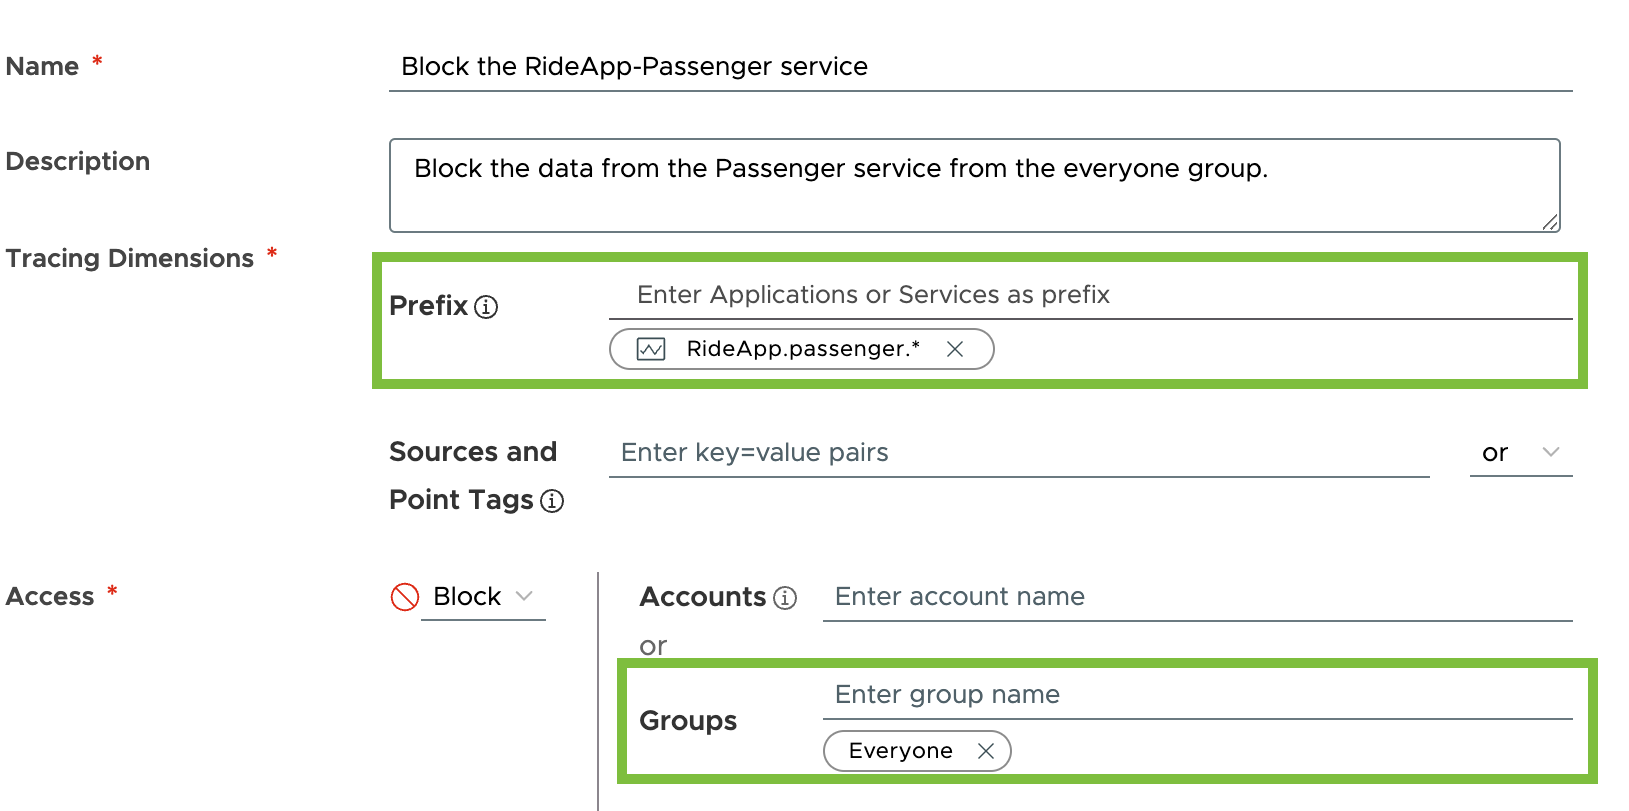
Here’s an annotated screenshot that shows the main actions:
Examples of Traces Security Policy
In this example, you have a traces security policy created to block trace data from the RiderApp’s passenger service for the Everyone user group. When the traces security policy is in place:
- Users who belong to the Everyone user group won’t see the passenger service data on the Traces Browser, Service Dashboard, Operations Dashboard, and Application Status page.
- Super Admin users can see all the data.
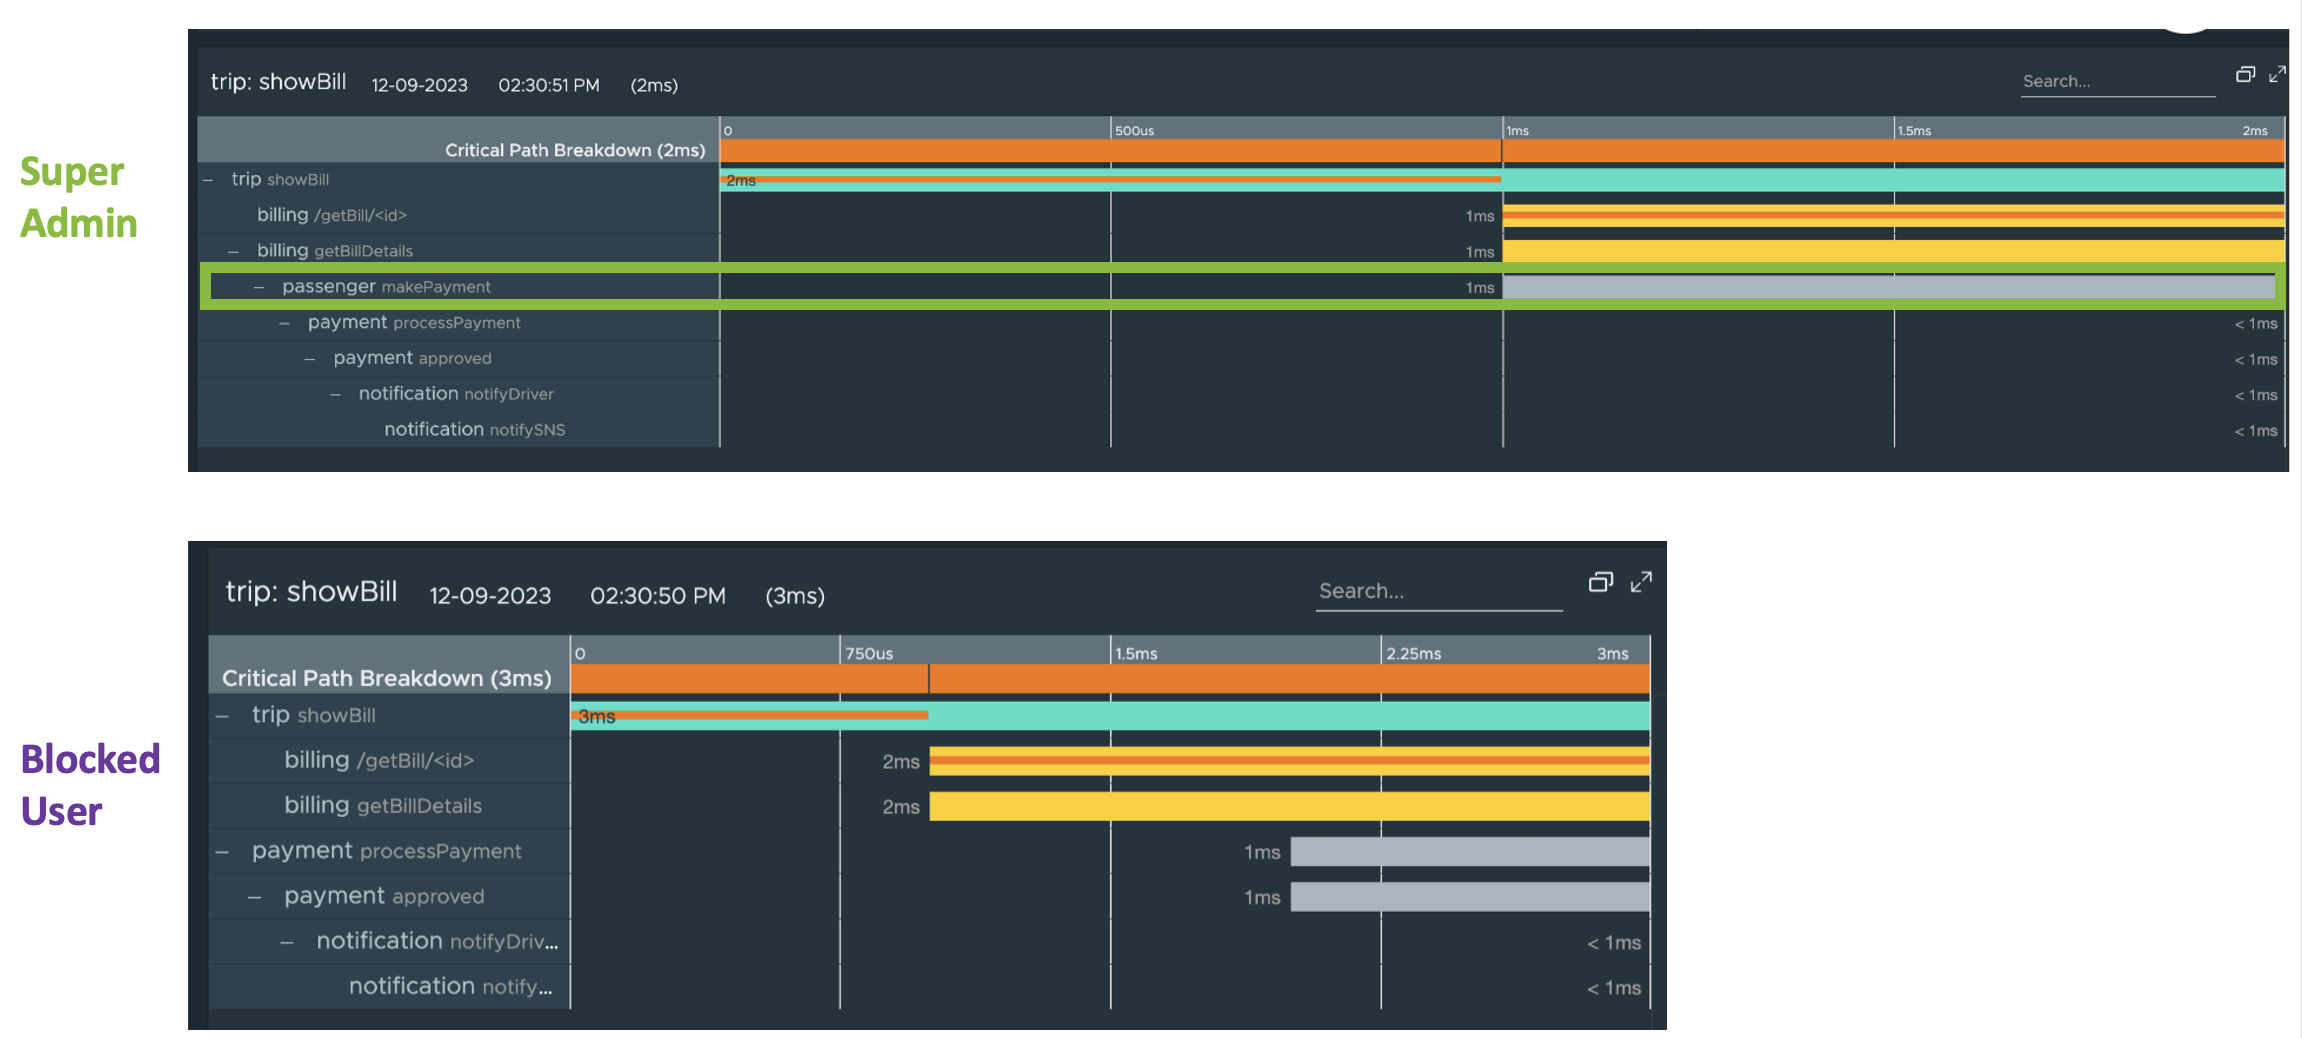
The screenshots below show you how the blocked trace data does not show up for a user in the Everyone user group and how the data shows up for a Super Admin user.
-
Traces Browser: The Super Admin user can see the passenger service on the Traces Browser, while the other user, who belongs to the Everyone group, cannot see the passenger service on the Traces Browser.
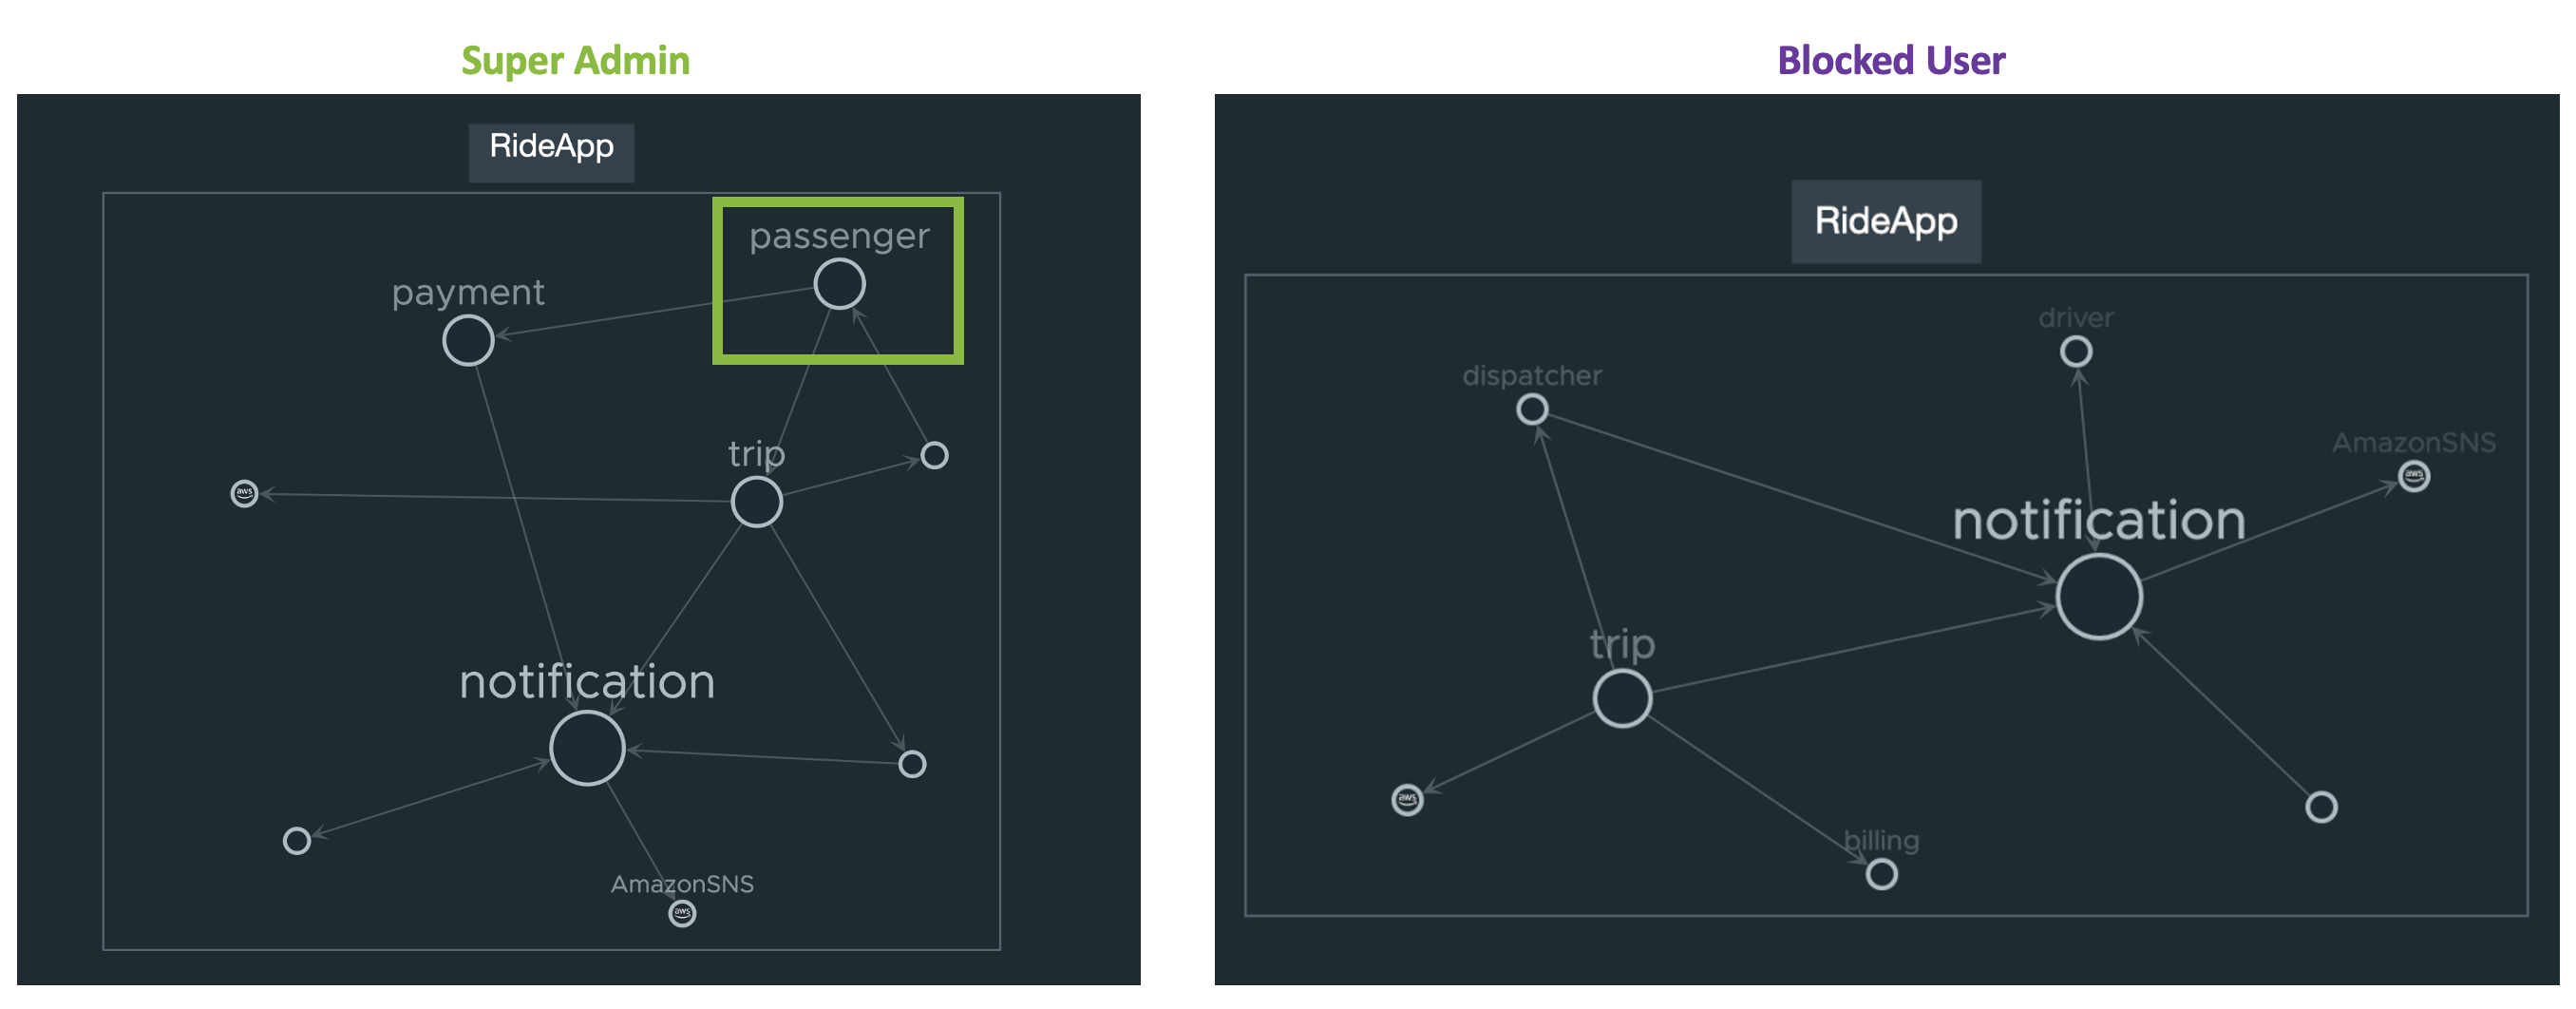
-
Application Map: The Super Admin user can see the passenger service on the Application Map, while the other user, who belongs to the Everyone group, cannot see the passenger service on the Application Map.
|
Manage Multiple Security Policy Rules
The following annotated screenshot gives an overview of rule management options:
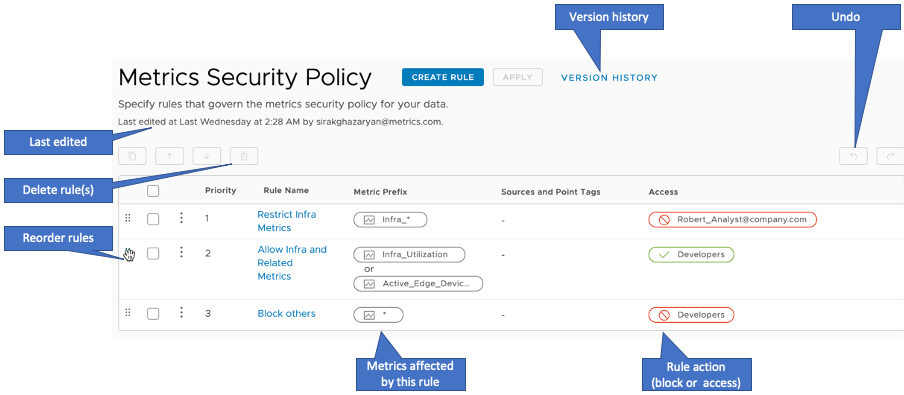
Here’s a tour:
- Click Version History to:
- Revert to an earlier version of the policy.
- Look at information on who last edited the security policy and when that happened.
- Examine the Metric Prefix column to see the metrics affected by a rule.
- Look at the Access column to see whether the rule allows or blocks access.
- Select the check box to the left of a rule to select it, then use the icons above to clone or delete the selected rule.
- Select the check boxes to the left of multiple rules to select them, use the icons to indicate changes, and click Save to commit the changes.
- Click the six-dot icon to explicitly drag a rule where you want it and change the rule prioritization.
- If you’ve moved, cloned, or deleted one or more rules, use the Undo button to undo the change, or Redo to revert the undo.
|