This page lists new and updated features for the Tanzu Observability service.
- For Wavefront Proxy, your go-to place is the Wavefront proxy GitHub page. On that page, you can see releases in progress and GA versions. If proxy changes are important for the service, we update this doc set, for example, with new configuration parameters, ports, etc.
- For the latest changes and releases of our Integrations, see the Integrations Release Notes.
- For Observability for Kubernetes, go to the release notes for Observability for Kubernetes GitHub repository.
Announcements
Tanzu Observability on VMware Cloud Services
Starting July 3, 2023, Tanzu Observability is a service on the VMware Cloud services platform. After this date, we support two types of subscriptions:
- Onboarded Subscriptions: Tanzu Observability subscriptions that are onboarded to the VMware Cloud services platform.
- Original Subscriptions: Existing subscriptions which remain as is until onboarded to VMware Cloud services.
For information about the two subscription types and how they differ, see Subscription Types.
Free Trial of Tanzu Observability on VMware Cloud Services
Starting September 20, 2023, all new trial instances of Tanzu Observability are onboarded to VMware Cloud services. You can start a free trial directly from the VMware Cloud Services Console.
Onboarding Original Tanzu Observability to VMware Cloud Services
In October, 2023, we start to incrementally onboard all original subscriptions to VMware Cloud services. You will receive a notification in your Tanzu Observability UI with the date scheduled for your service onboarding to VMware Cloud services. Make sure that you get familiar with the VMware Cloud services platform and prepare for the onboarding. See What Should I Do Before the Onboarding?.
2024-09.x Release Notes
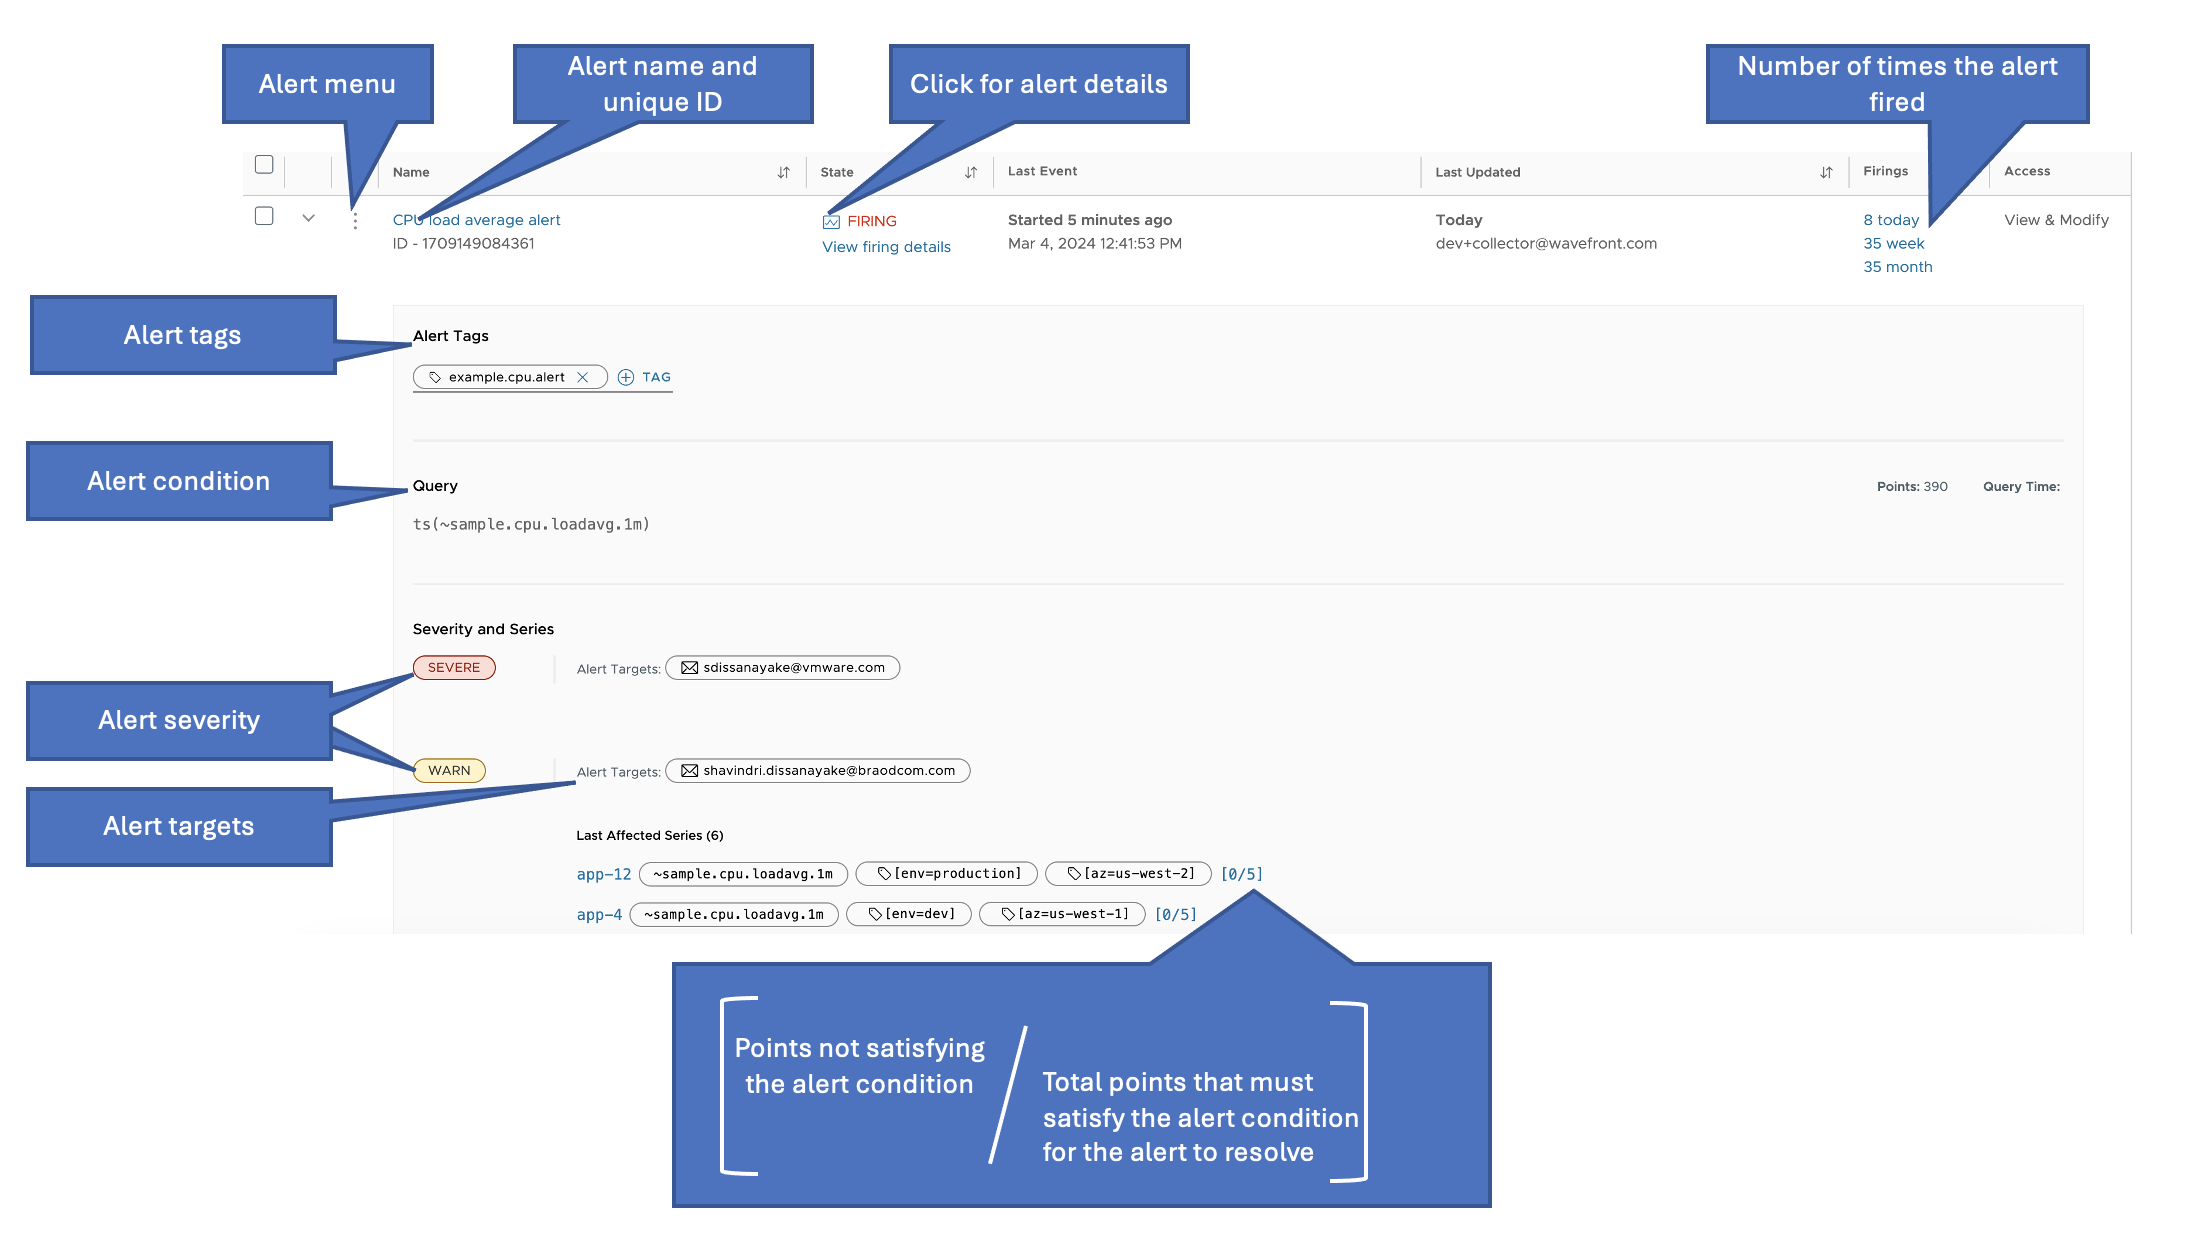
Alerts Browser Improvements: We improved the user experience of the Alerts Browser. To navigate to this page, select Alerting > All Alerts.
2024-07.x Release Notes
Ephemeral Internal Metrics: Most of the internal metrics are now ephemeral and not convertible to persistent. Exceptions are the following internal metrics, which remain persistent:
~collector.*points.reported~externalservices.*.points~derived-metrics.points.reported~collector.*histograms.reported~derived-histograms.histograms.reported~collector.*spans.reported~query.metrics_scanned~proxy.points.*.received~proxy.histograms.*.received~proxy.spans.*.received~proxy.spanLogs.*.received~proxy.build.version~metric.global.namespace.*~histogram.global.namespace.*~counter.global.namespace.*
2024-05.x Release Notes
-
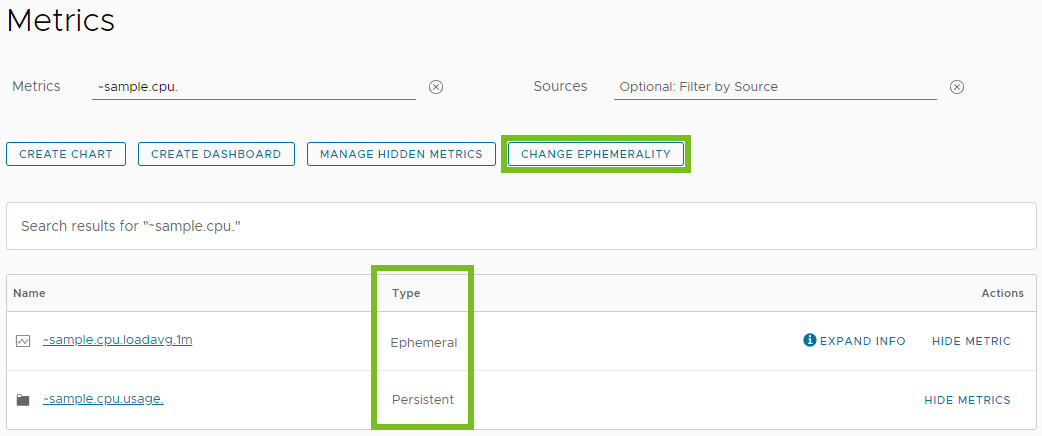
New Ephemeral Metric Type: With this release, we introduce ephemeral metrics, which have a short retention period. Ephemeral metrics are retained for 28 days, whereas persistent (default) metrics are retained for 18 months. For details, see Metric Types per Retention Period.
Note: By default, all ingested metrics are persistent but are now convertible to ephemeral.On the Metrics Browser:
- All users can view the type of each metric - persistent or ephemeral.
- Super Admin users can convert metrics from persistent to ephemeral and the reverse. For details, see Change the Retention Period of Metrics.
 Note: Converting persistent metrics to ephemeral improves the query performance and reduces the cardinality. Consider converting metrics that are relevant for a short time and that have high cardinality, such as the Kubernetes metrics (
kubernetes.). -
Replace all
~agent.metrics with~proxy.: The~agent.metrics were deprecated a few years ago. With this release, our service no longer supports the~agent.metrics. You must replace all the~agent.metrics with~proxy.to ensure that your charts don’t break.For example:
# Deprecated metric:
rawsum(align(1m, mean, ts(\"~agent.buffer.task-count\")))

# Replace with:
rawsum(align(1m, mean, ts(\"~proxy.buffer.task-count\")))
2024-03.x Release Notes
-
Updated Support Link: The link for contacting our Technical Support team from within the Tanzu Observability user interface is now updated. To open a support ticket, click the gear icon on the toolbar and select Support.
-
Derived Metrics Browser Improvements: We improved the user experience of the Derived Metrics Browser. To navigate to this page, select Browse > Derived Metrics.
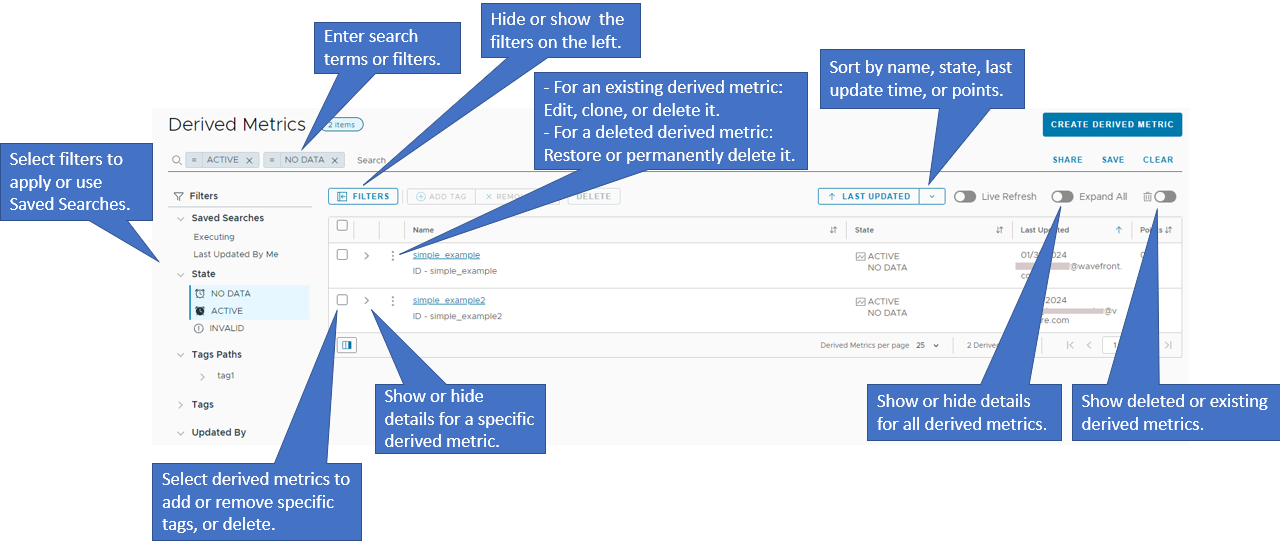
On this page, now you can:
- Apply various filters and hide or show the filters listed on the left.
- Search for derived metrics, save and share searches.
- Click Create Derived Metric to add a derived metric.
- Choose to display only the existing or only the deleted derived metrics.
- Sort the derived metrics by name, state, time of the last update, or number of points.
- Show or hide details for specific or all derived metrics.
- Use the ellipsis icon menu to:
- Edit, clone, or delete an existing derived metric.
- Restore or permanently delete a deleted derived metric.
- Select one or more derived metrics to add or remove specific tags for them, or to delete them.
2024-01.x Release Notes
Amazon Web Services Integration Improvement: You can now disable the ingestion of support service limit metrics. See the Integrations Release Notes for details.