The Apdex score helps you understand how the response time of a service compares to the predefined response time threshold. See Configure Apdex Settings for details.
You can query data, create charts, and create alerts using the apdex() function.
Use the basic or advanced query format.
- Basic apdex() queries are simple to use and don’t require
hs()(histograms query) knowledge. These queries give you results for a specific application and service. - Advanced apdex() queries let you specify advanced
hs()queries. You can also query Apdex data for more than one application or service.
Summary
-
Basic Query
apdex([T, | T, 4T,] application=<application_name>, service=<service_name>) -
Advanced Query
apdex([T, | T, 4T,] <histogram_series>)
apdex(application=<application_name>, service=<service_name>, <histogram_series>)
Parameters
| Parameter | Description |
|---|---|
application_name
|
Name of the application you want to see data for. |
service_name
|
Name of the service you want to see data for. |
T
|
Satisfied threshold.
|
4T
|
Tolerating threshold. If you don't specify the value, it uses T*4.
Note:
We don't save the value you define for the tolerating threshold (4T).
The values are in microseconds. For example, if you enter 800, it indicates 800 microseconds.
|
histogram_series
|
An advanced hs() query. See Histogram to Histogram Functions.
|
Description
You can use the basic or advanced apdex() function to query the Apdex score. Our service derives the Apdex score for each service. Therefore, you must specify the service you want to get the Apdex data.
The basic queries use hs(tracing.aggregated.derived.*.duration.micros.m) as the underlying query to get the Apdex scores. See Aggregated RED Metrics. Basic queries only give you the Apdex score for a given service. Therefore, you need to specify the application and service filters.
The advanced queries let you customize the hs() functions. You can get the Apdex score for more than one application using the advanced queries. Therefore, you can create alerts to find out when the Apdex score of the services in an application are below a specific range.
If histogram data is in milliseconds, you need to add the threshold value to the apdex function and divide the threshold value by 1000 to ensure that the threshold value is in milliseconds too.
Example:
apdex( T/1000, <histogram_series_in_milliseconds>)Examples
Here’s how you can use these queries:
- Use a basic query to get the Apdex score of the
beachshirtsapplication’sshoppingservice over time.apdex(application=beachshirts, service=shopping)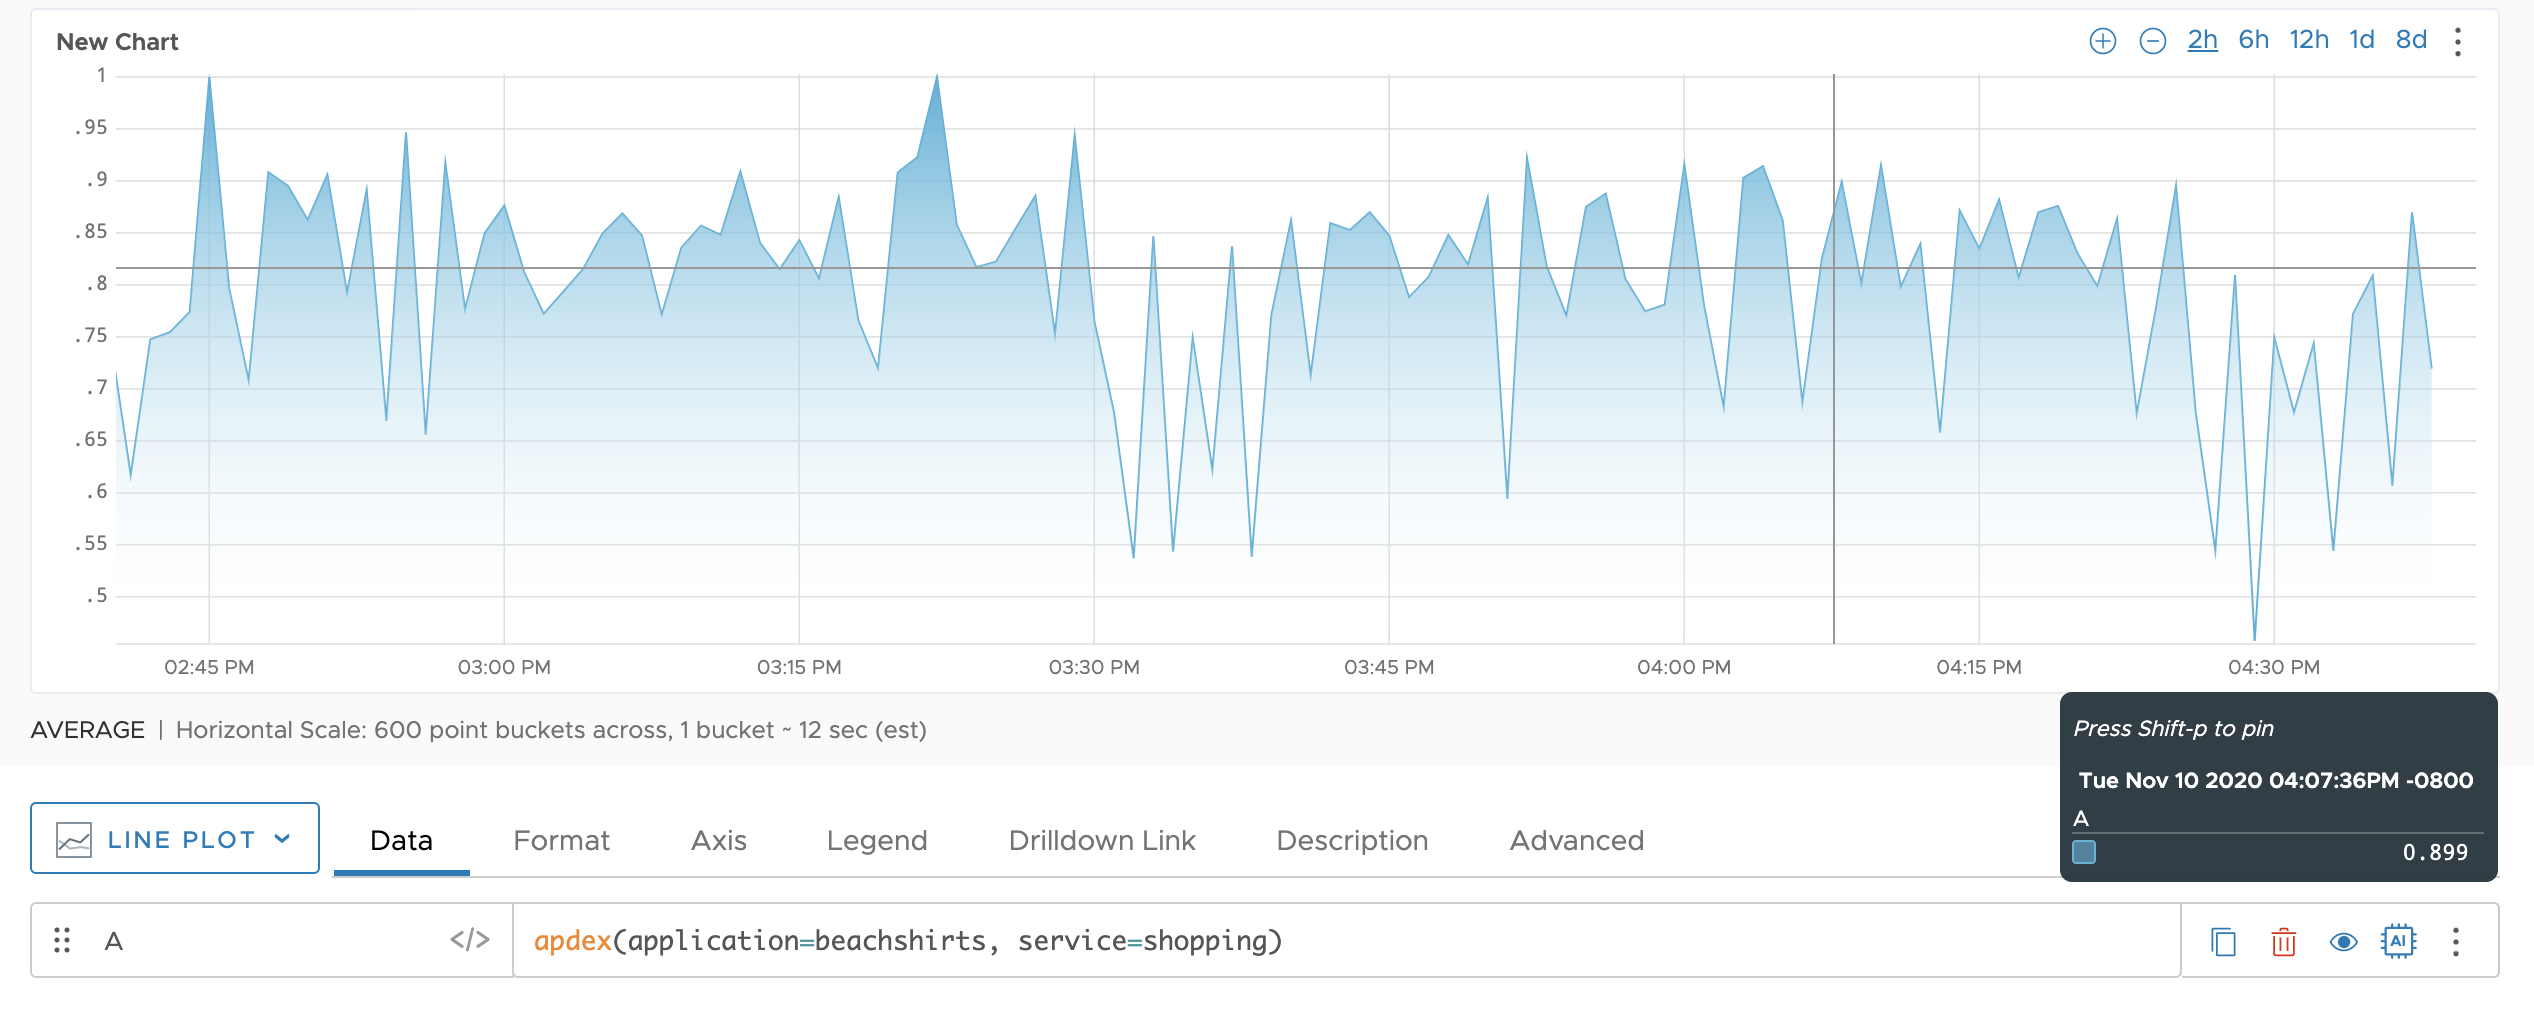
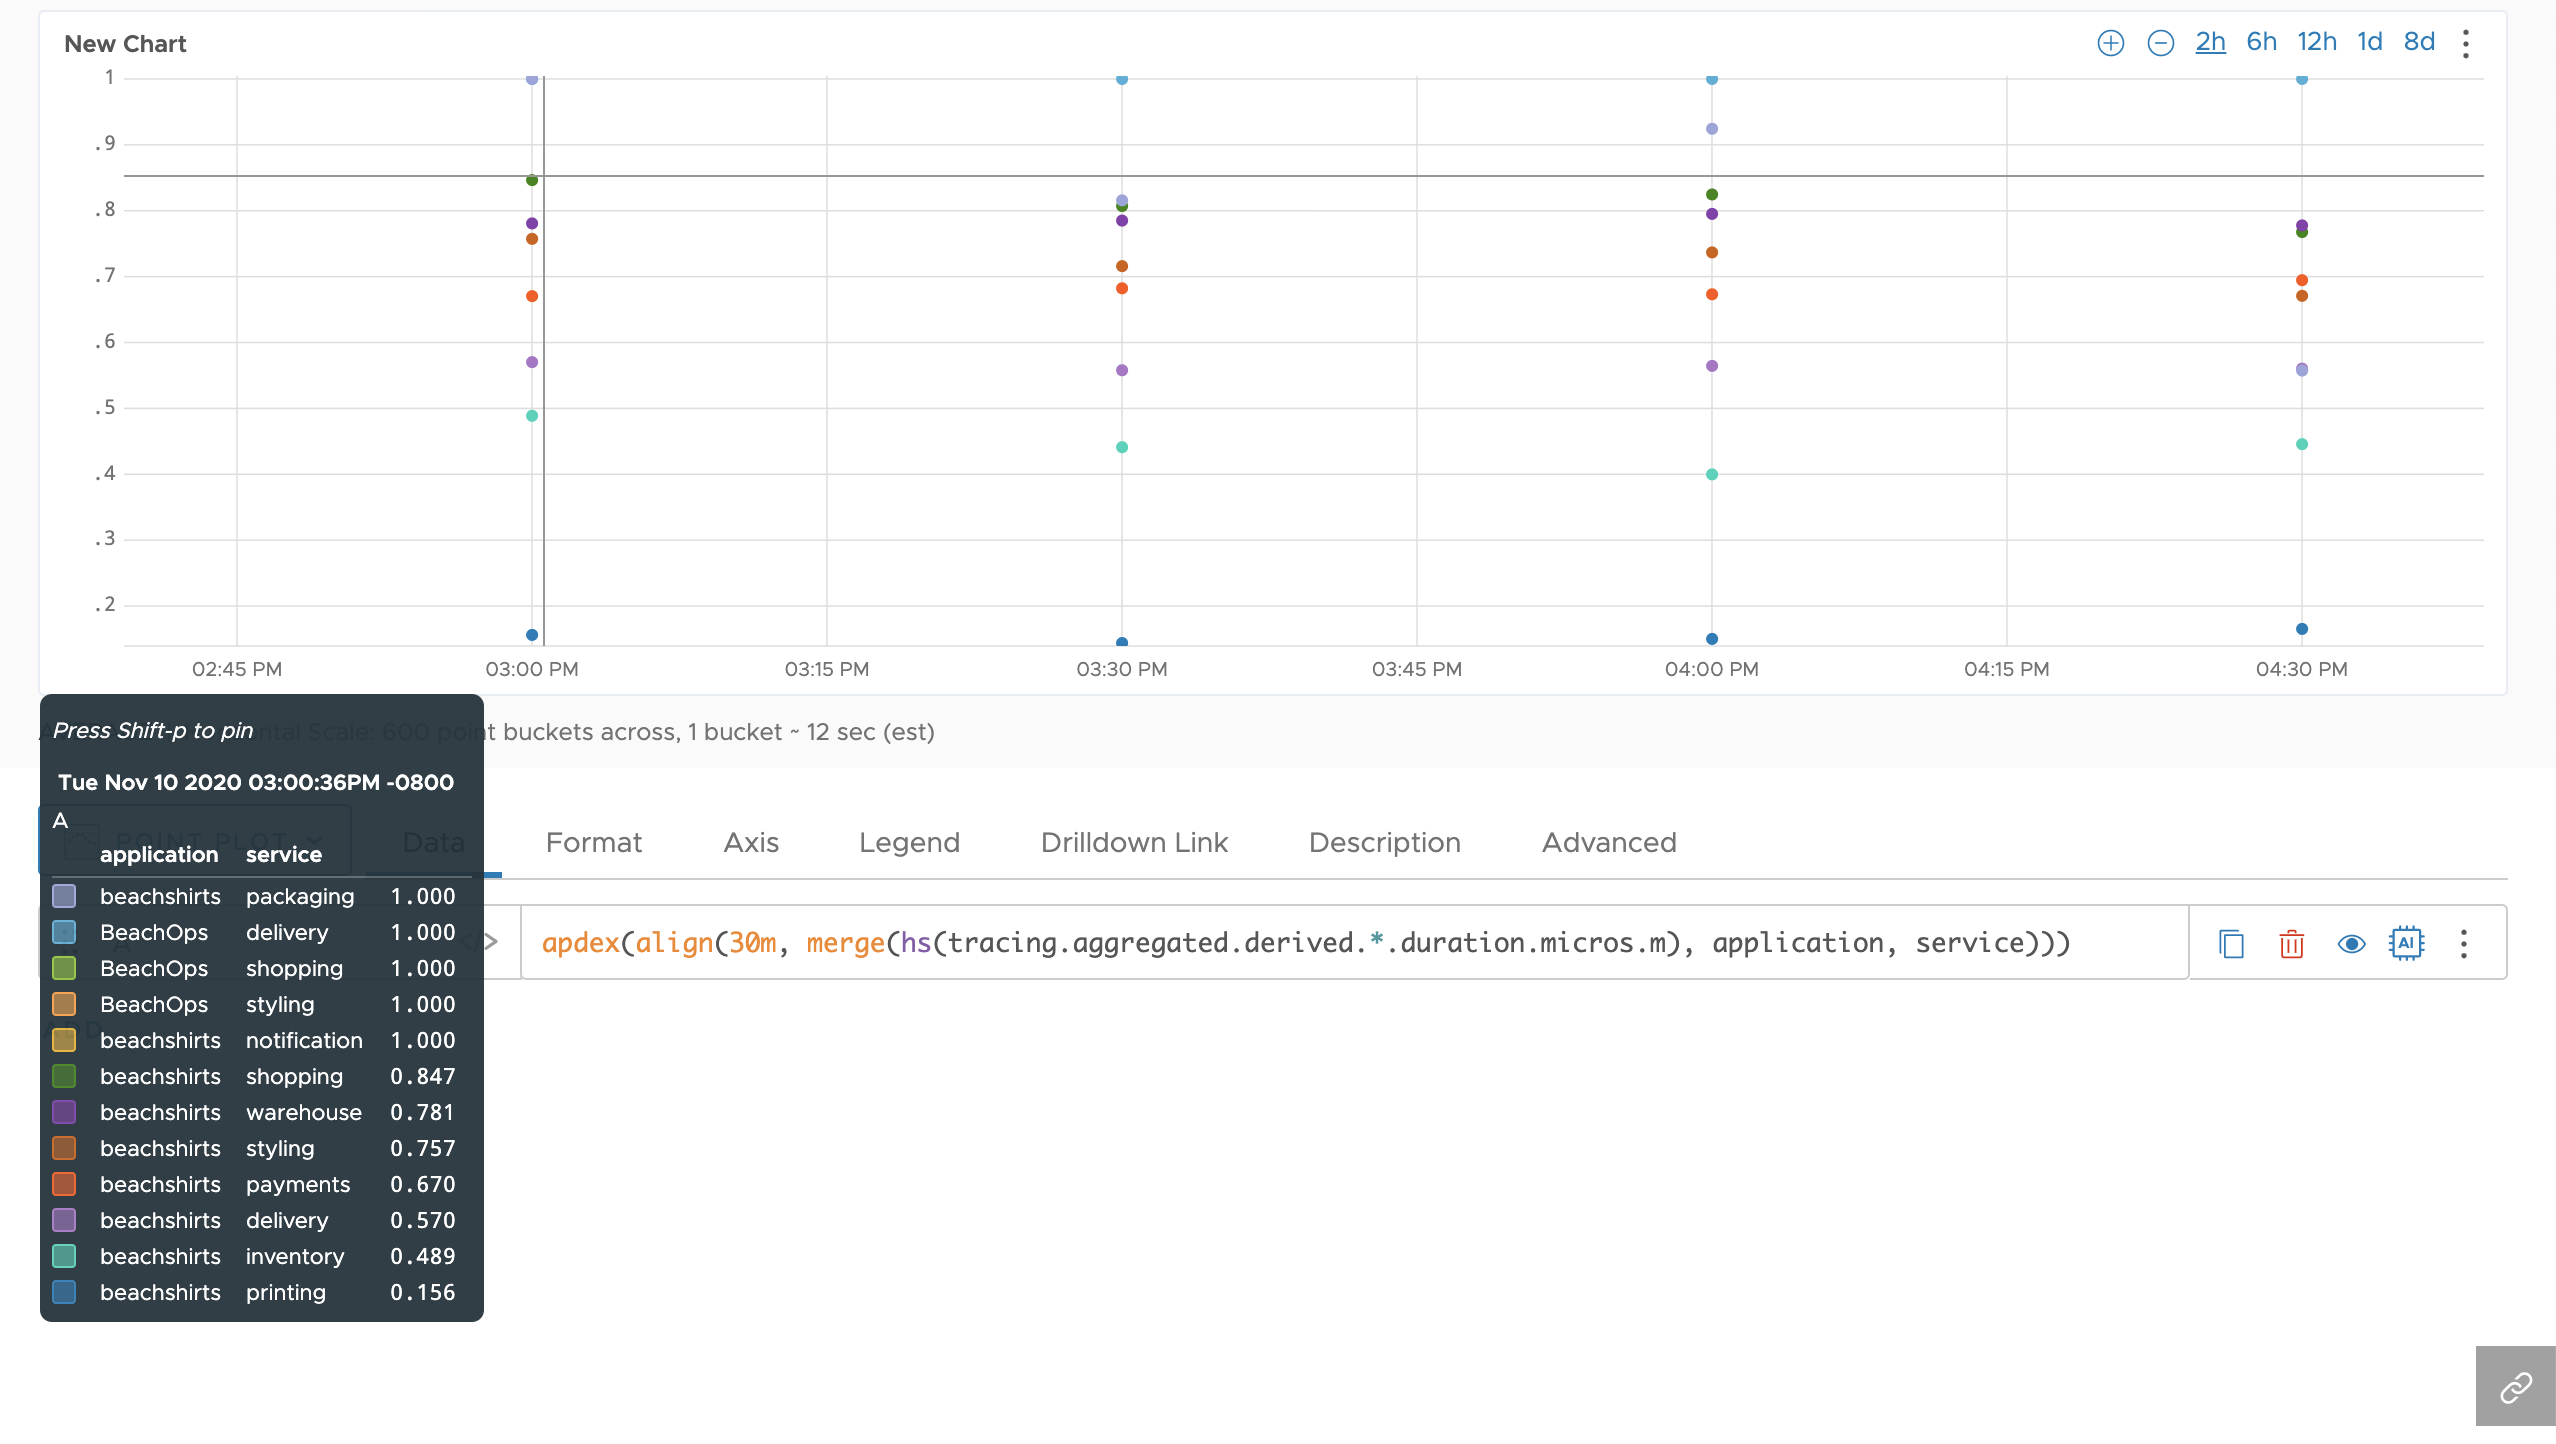
- Use an advanced query to return the Apdex score of all the services that send data to our service every 30 minutes.
apdex(align(30m, merge(hs(tracing.aggregated.derived.*.duration.micros.m), application, service)))
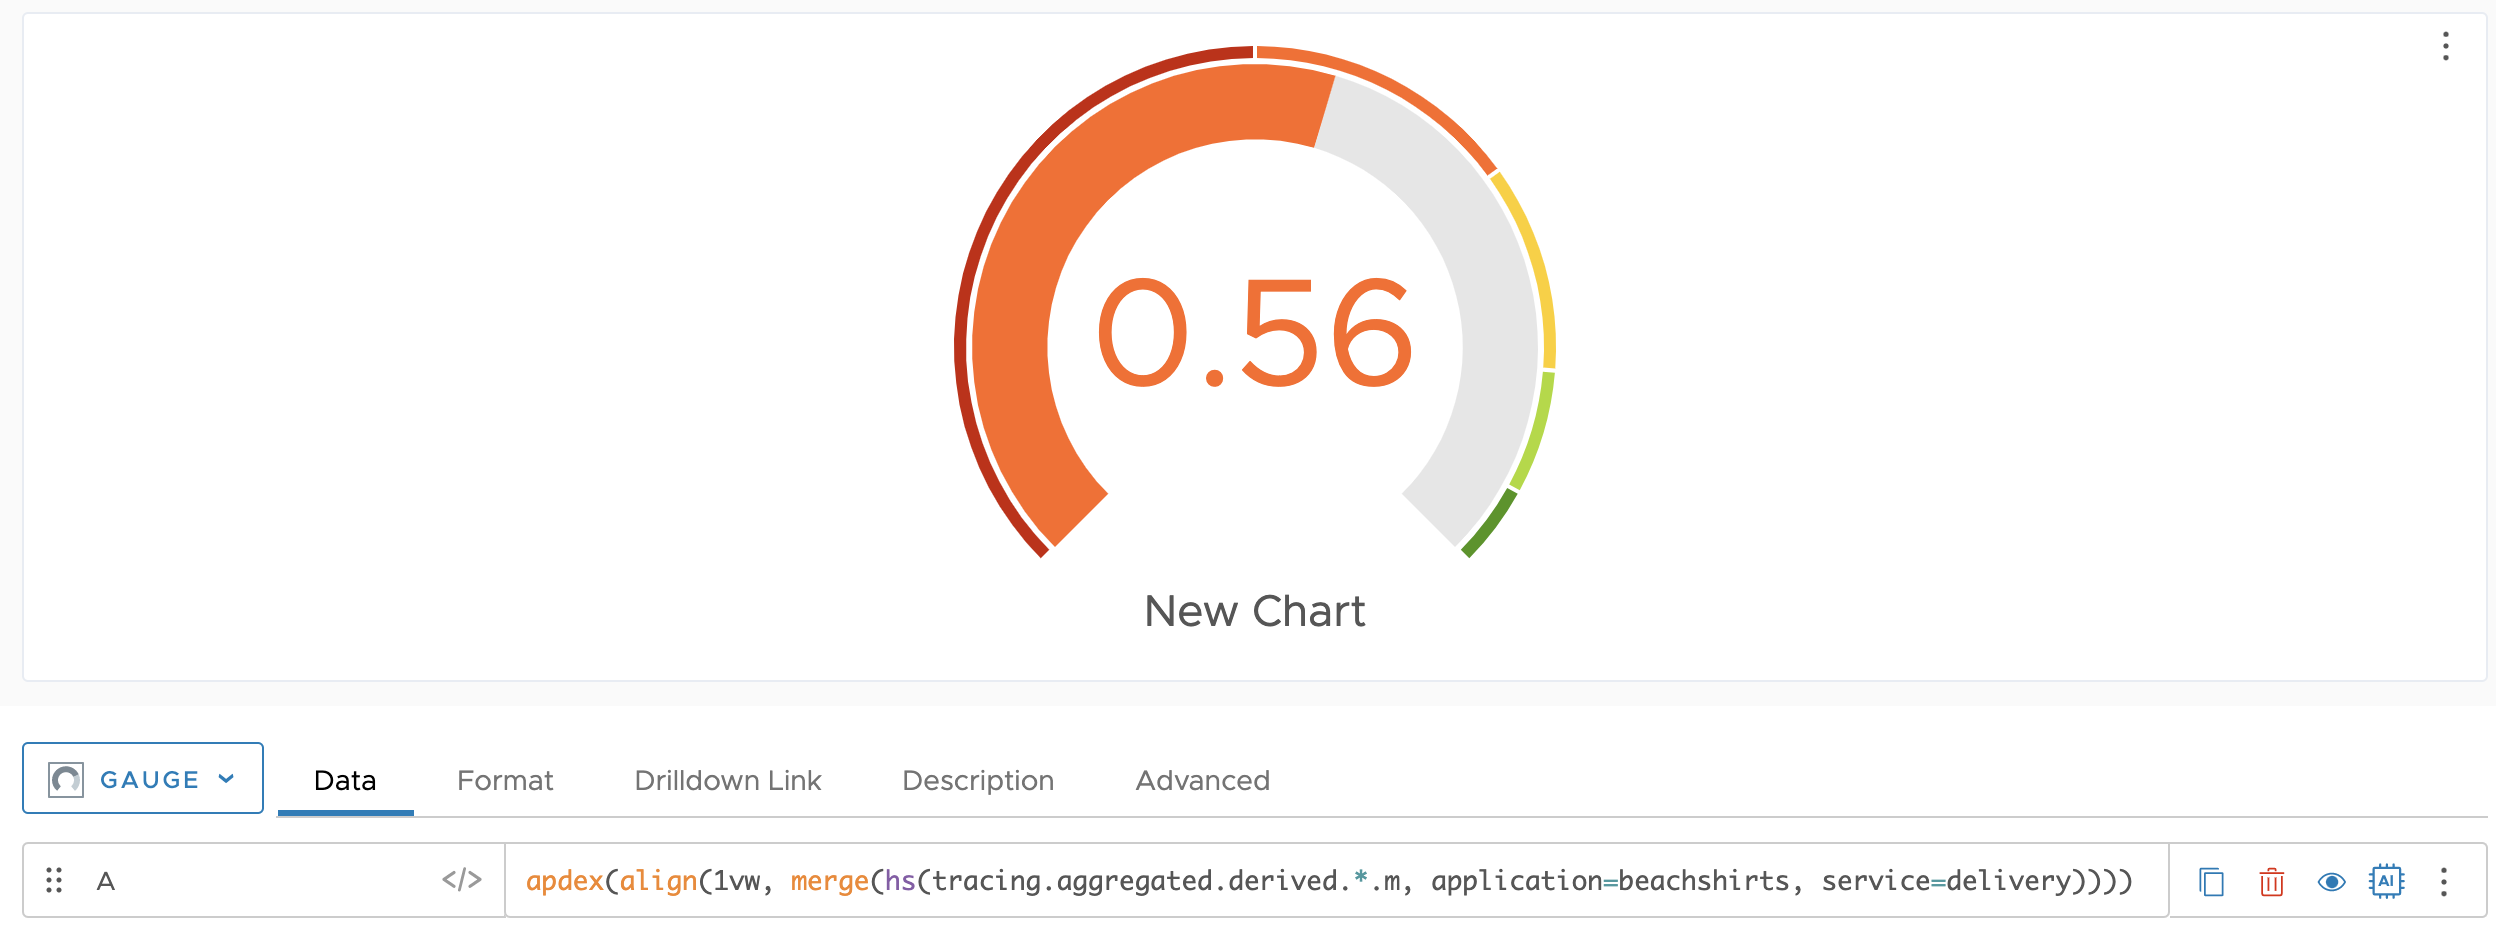
- Use an advanced query to get the Apdex score of the
beachshirtsapplication’sshoppingservice for the given time window (1vw). Let’s use a gauge chart.apdex(align(1vw, merge(hs(tracing.aggregated.derived.*.m, application=beachshirts, service=delivery))))
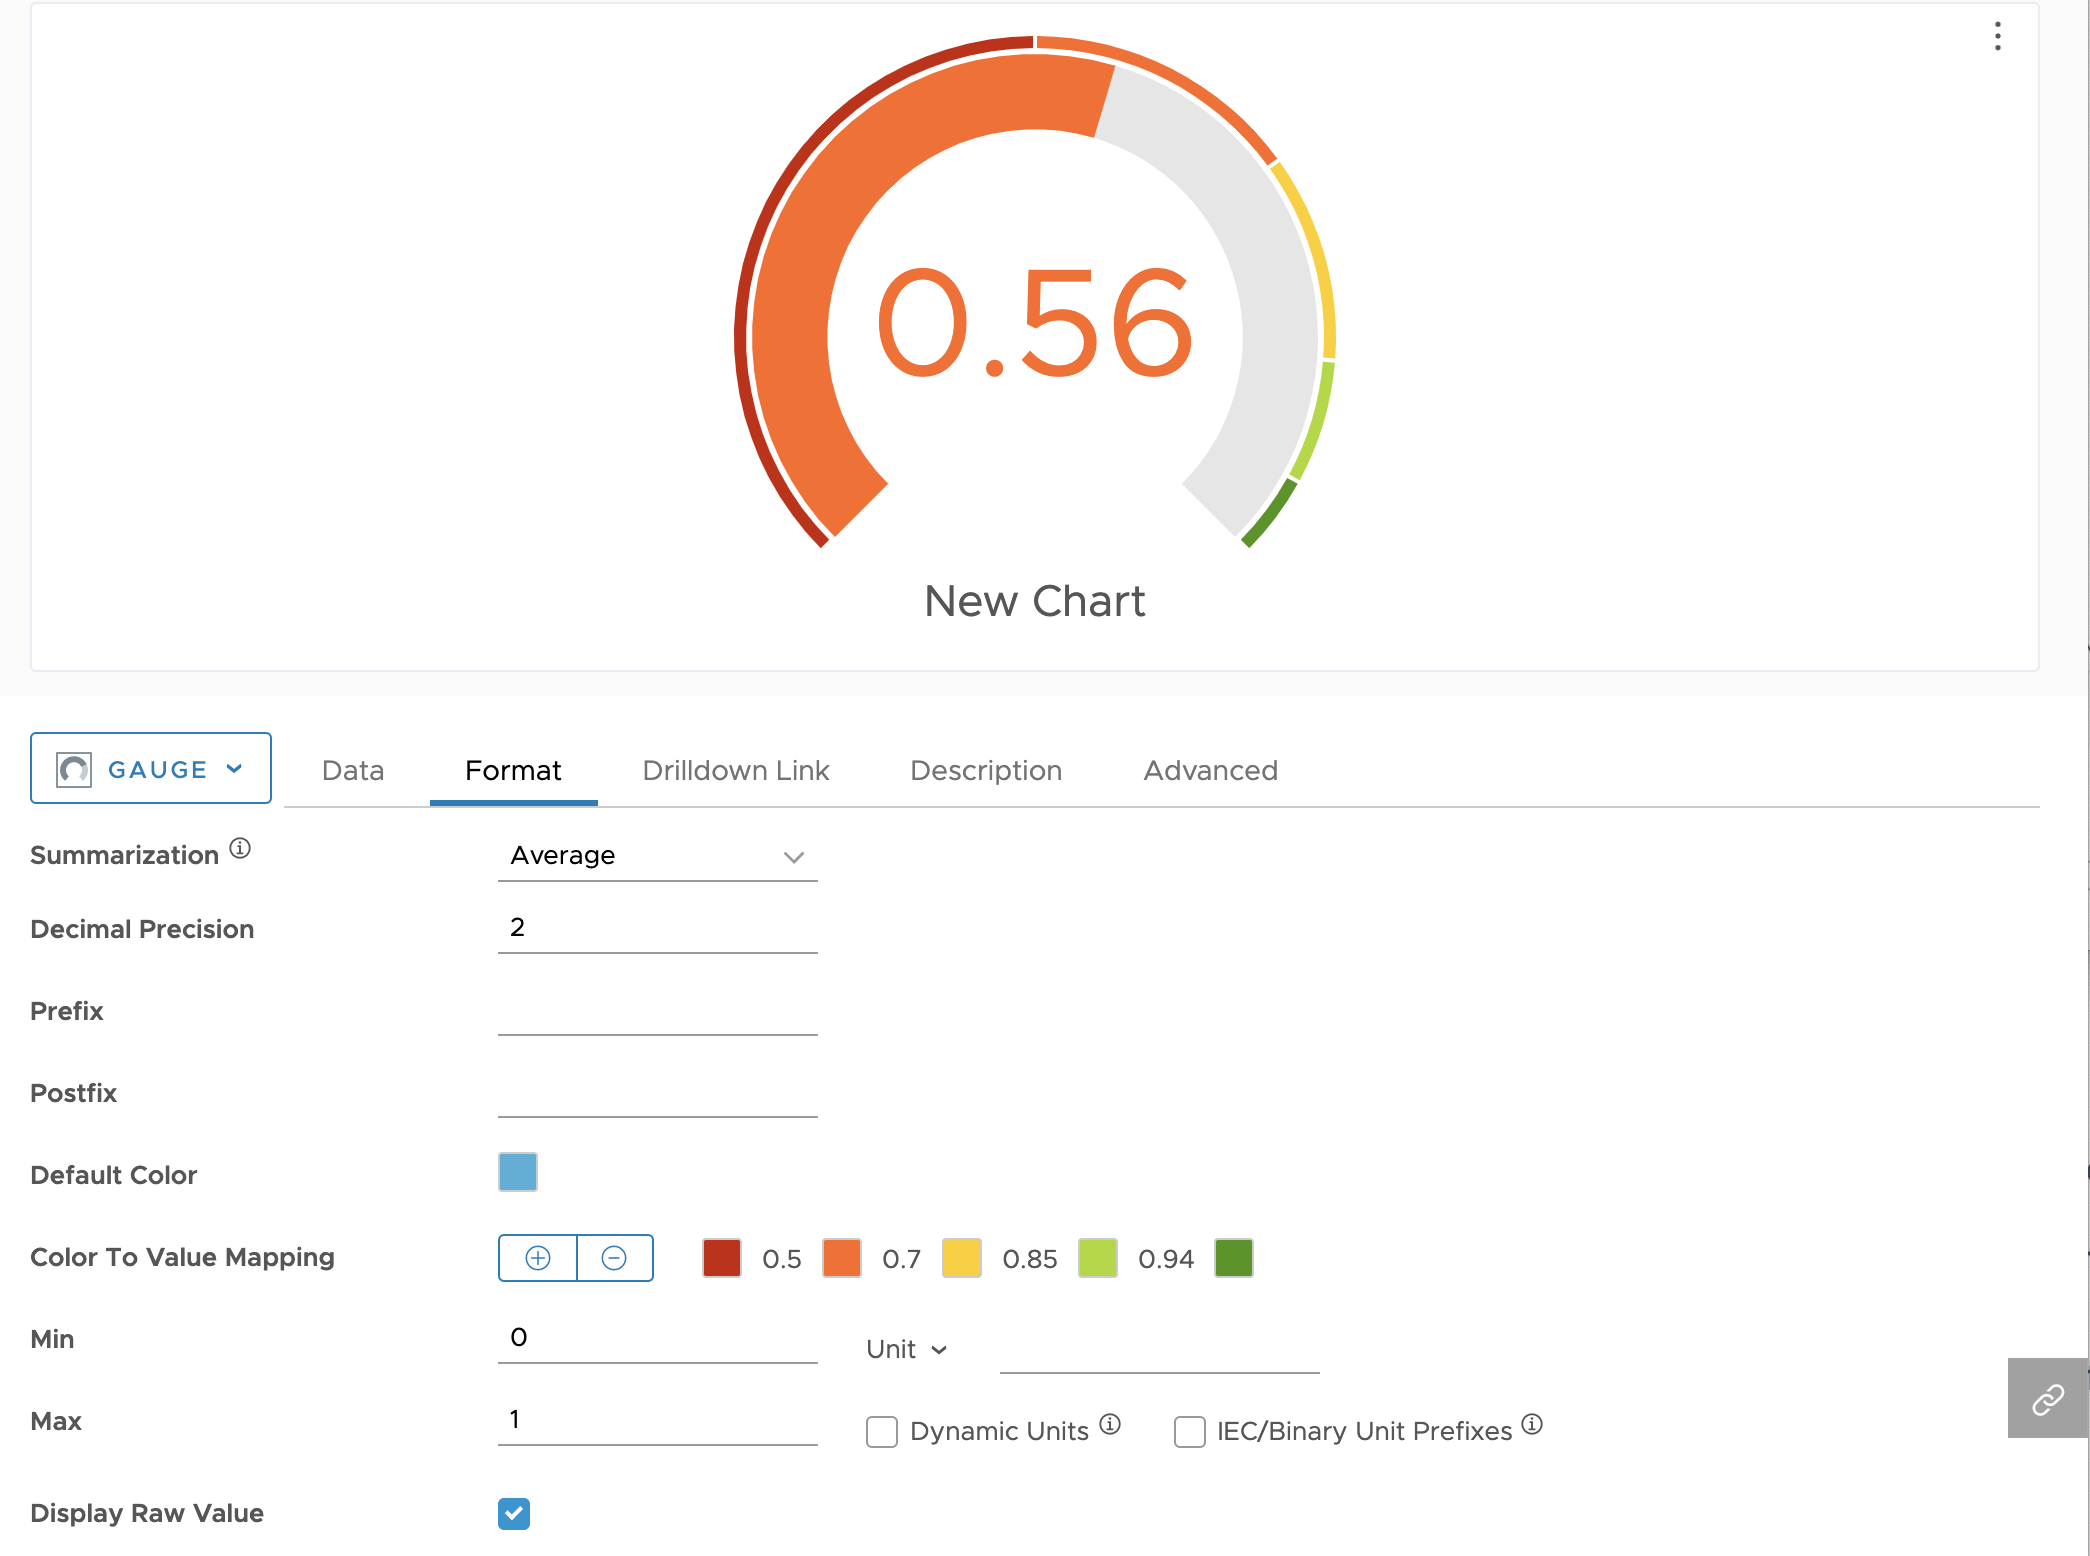
Our service rounds the Apdex score to 2 decimal points so that it is easy for you to interpret the score. You need to update the gauge chart settings to get the color to value mapping and round the value to 2 decimal points.
See Also
- Get an overview of how the Apdex score is calculated and Configure Apdex Settings.
- Use apdexLatency() to query the satisfied threshold (T) and toleration threshold (4T) of a service.