Want to learn some tips and tricks for exploring your data in dashboards?
This tutorial uses our sample data to get you started. To complete the tasks, you need Access to a product instance. If your company doesn’t have one, sign up for a free trial.
The focus in tutorial is on exploration, so you don’t need any permissions to go through these tasks.
Task 1: Find a Sample Dashboard in the Dashboards Browser
Tanzu Observability (formerly known as VMware Aria Operations for Applications) includes pre-built tutorial and tour integrations with dashboards that show how to use the product with sample metrics. Let’s explore a tour dashboard, which contains sample data.
|
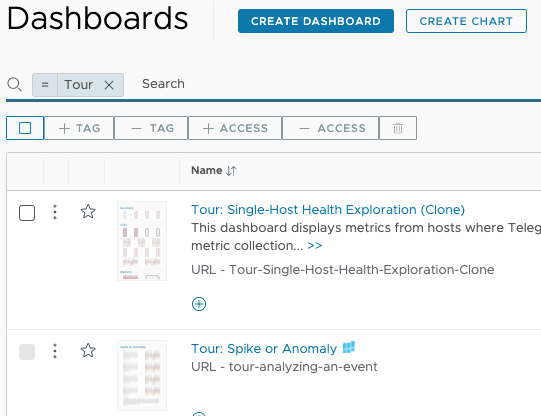 |
The result looks similar to the following screenshot:
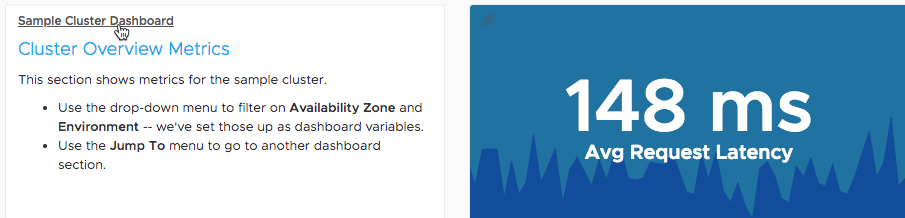
Task 2: Explore the Dashboard
By default, the Tour: Cluster Metrics Exploration dashboard shows live (sample) data. Let’s change the time window and explore other dashboard customization options.
| 1. To change the time window, click the time selector and select, for example, Last 12 hours. All charts in the dashboard are updated to the new time window. | 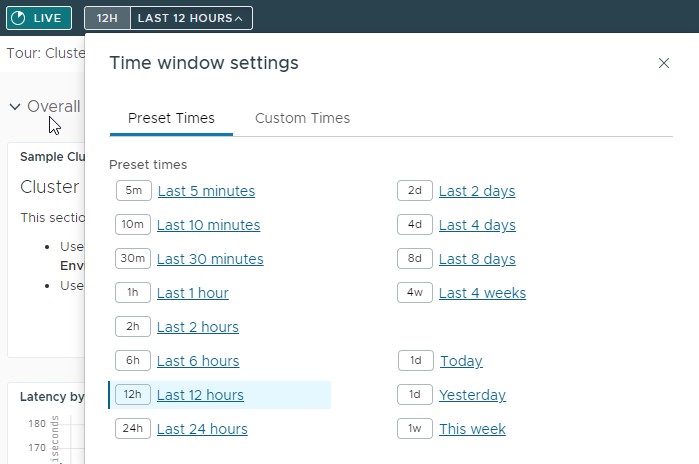 |
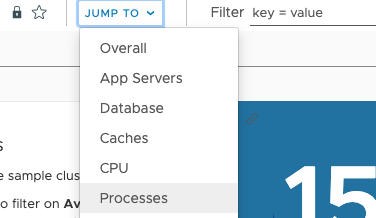
2. Notice the options below the time selector, and select Jump To > Processes to show the Processes section.
Below the time selector, you see:
|  |
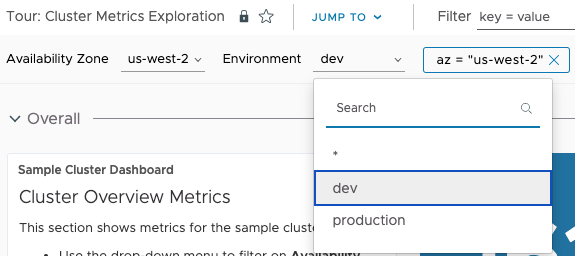
3. To filter data, type az = us-west-2 in the filter field. All charts in the dashboard are updated to show only data from the us-west-2 availability zone.
When you select one filter, other filters become available below. Explore how you could also set the environment to production, dev, or both. |
 |
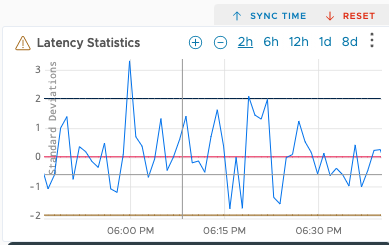
4. Finally, explore time selection and time sync across charts.
|
 |
Task 3: Drill Down Into Charts
To edit dashboards and charts, you need Dashboards permission. But even without those permissions, you can learn a lot from drilling down into a chart.
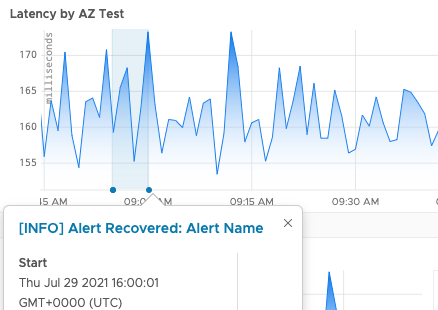
1. Let's start with viewing events for system alerts.
|
 |
|
2. Move to the right and explore changing the time window. 3. Next, select Edit from the ellipsis menu. You can instead click the name of the chart to put it in edit mode. | 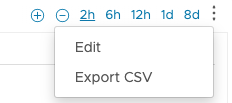 |
|
4. Select the chart type drop-down, which shows Line Plot initially, and select Stacked Area. If the filter is still set to us-west-2, consider removing it for a more interesting chart. |
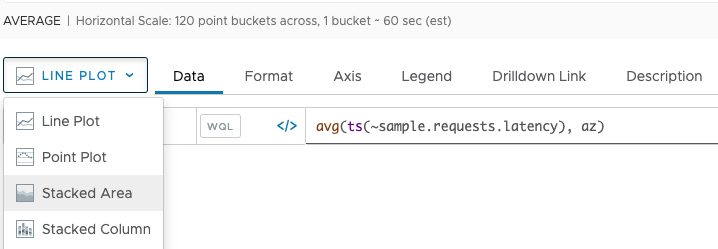 |
|
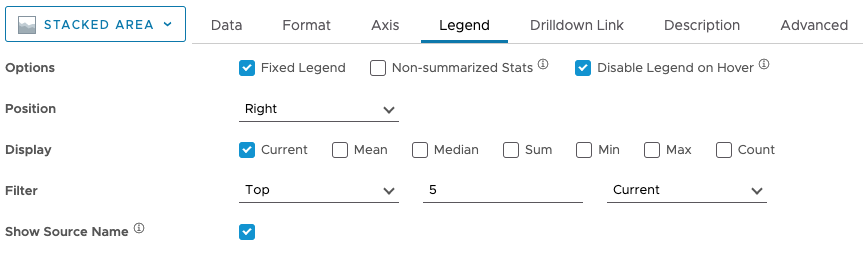
5. Next, explore the chart options to examine how you can adjust the view of your data. Each chart type has chart-specific options. See Chart Reference for details. 6. Finally, click Back to return to the dashboard to continue exploring. Because this Tour dashboard is a system dashboard, you cannot save changes even if you have Dashboards permissions. Clone the dashboard if you want to make a copy and save changes there. |
 |
Learn More
- Even if you don’t have Dashboards permissions, you can do an in-depth analysis of your data.
- See Examine Data with Dashboards and Charts, which includes an intro video.
- Watch some videos in the Examine Data in the Dashboards and Charts playlist in our VMware TV channel here

- If you have permission to edit and save dashboards and charts, you can do more:
- To get started, watch some videos in the Create, Manage, and Optimize Dashboards and Charts in our VMware TV channel here
- Create and Customize Dashboards.
- Create and Customize Charts.
- To get started, watch some videos in the Create, Manage, and Optimize Dashboards and Charts in our VMware TV channel here