The AWS Lambda Functions integration includes:
- Setup instructions
- Information about standard metrics that the integration includes
- Links to instructions for collecting custom business metrics
On this page, we give some background and details not available on the integration page.
Tanzu Observability and AWS Lambda
AWS Lambda is ideal for situations when you want to run a function in response to an event. Use cases include generating thumbnails whenever users upload images to a website or similar scenarios. You define the function in one of the languages that AWS Lambda supports, and the function runs whenever a triggering event occurs. This model is called Function-as-a-Service or serverless.
While it’s convenient to stop worrying about function execution, you might want to monitor the function. We offer these choices to monitor your AWS Lambda function:
- Use the Amazon CloudWatch integration. Using the CloudWatch integration allows access to the full set of standard metrics, but polling CloudWatch and send the data to Tanzu Observability introduces some lag.
- Use the AWS Lambda Functions integration. The integration collects standard metrics available through the public API. It also allows you to monitor business metrics by using a wrapper in Python, Go, or Node.js.
How to Use Tanzu Observability to Monitor AWS Lambda
To support monitoring serverless environments, we include a metric type called delta counter. With delta counters, Tanzu Observability points are aggregated to the minute bucket. That avoids point collisions.
The AWS Lambda Function integration and the SDKs listed above make it easy to collect standard metrics and custom metrics.
| Use Case | Description |
|---|---|
| AWS Lambda standard metrics | We collect AWS Lambda standard metrics for you. You can see these metrics in the integration’s dashboard, and use them in queries and alerts. Some metrics are counters, others are delta counters. |
| AWS Lambda custom business metrics | The AWS Lambda Functions integration includes pointers to instructions for using Python, Go, or Node.js to retrieve business metrics for your Lambda function. |
Ingesting AWS Lambda Cold Start Metrics into Tanzu Observability
An AWS Lambda “cold start” is the first request that a new AWS Lambda instance handles. Once the request is complete, the instance stays up-and-running, so that it can handle the subsequent requests. There is no defined time when this first instance will be removed. If an instance has been accidentally removed, “cold start” will happen again. As a result, the response time increases, because “cold start” will keep happening and you won’t be able to find the cause behind this.
You can overcome this situation, by reporting a new metric to the product service which allows you monitor the “cold start” duration. In many cases, the AWS Lambda “cold start” metrics are not being reported to CloudWatch. They are just logged.
Step 1: Create an IAM Policy in AWS
- Log in to your AWS account.
- Search for the IAM (AWS Identity and Access Management) service and click it.
- Under Access Management click Policies.
- Click the Create policy button.
- Click the JSON tab, enter the following snippet, and click Next: Tags.
{ "Version": "2012-10-17", "Statement": [ { "Sid": "VisualEditor0", "Effect": "Allow", "Action": [ "logs:CreateLogGroup", "logs:CreateLogStream", "logs:PutLogEvents", "cloudwatch:PutMetricData" ], "Resource": "*" } ] } - Click Next: Review, provide a meaningful name (for example,
aws-cold-start-policy) and, optionally, a description of the policy, and click Create policy.
Step 2: Create a Role in AWS and Assign the Policy to It
- Under Access management on the left, click Roles.
- Click Create role.
- Click the AWS service tile, select the Lambda radio button, and click Next.
- Search for the permission policy that you have created in Step 1 (in our example, this is
aws-cold-start-policy), select it, and click Next. - Provide a meaningful name (for example,
aws-cold-start-role) and, optionally, a description of the role, and click Create role.
Step 3: Create the AWS Lambda Function
Create a function and subscribe to it from your AWS Lambda function. This function will take care of filtering the cold start metrics and will report them to CloudWatch.
- In your AWS Management Console, search for the Lambda service and click it.
- Click the Create function button, and leave the Author from scratch tile selected.
- Enter the name of the function, for example
aws-cold-start-lambda-function. - From the Runtime menu, select Python 3.9 as the language to use to write your function.
- Under Architecture, leave x86_64 selected.
- Expand Change default execution role, select Use an existing role and select the role that you created in Step 2. For example,
aws-cold-start-role. - Click Create function.
Step 4: Deploy the Lambda Function
- Navigate to the newly created Lambda function (
aws-cold-start-lambda-function) and click it. - On the Code tab, under the aws-cold-start-lambda-function folder, select lambda_function.py
-
Add the following code snippet and click Deploy.
 import boto3
 import logging
 import json
 import gzip
 import base64
 from io import StringIO

 logger = logging.getLogger()
 logger.setLevel(logging.INFO)
 cloudwatch = boto3.client('cloudwatch')

 def lambda_handler(event, context):
     cw_data = event['awslogs']['data']
     compressed_payload = base64.b64decode(cw_data)
     uncompressed_payload = gzip.decompress(compressed_payload)
     payload = json.loads(uncompressed_payload)
     logEvents = payload.get("logEvents")[0]
     extractedFields = logEvents.get("extractedFields")
     response = cloudwatch.put_metric_data(
     MetricData = [
         {
             'MetricName': 'custom.initDuration',
             'Dimensions': [
                 {
                     'Name': 'logGroup',
                     'Value': payload.get("logGroup")
                 }
             ],
             'Unit': 'Milliseconds',
             'Value': float(extractedFields.get("lambda_init_duration_ms"))
         },
     ],
     Namespace = 'AWS/Lambda'
     )
     if response.get("ResponseMetadata").get("HTTPStatusCode") != 200:
         logger.error(response)

     return {
         'statusCode': response.get("ResponseMetadata").get("HTTPStatusCode"),
         'body': response.get("ResponseMetadata")
     }
Step 5: Create a Subscription Filter
Subscribe to the Lambda function that you’ve just created from the existing AWS Lambda function for which you want to monitor “cold start” metrics.
- In your AWS Management Console, search for the Lambda service and click it.
- Navigate to your Lambda function and click it.
- Click Monitor.
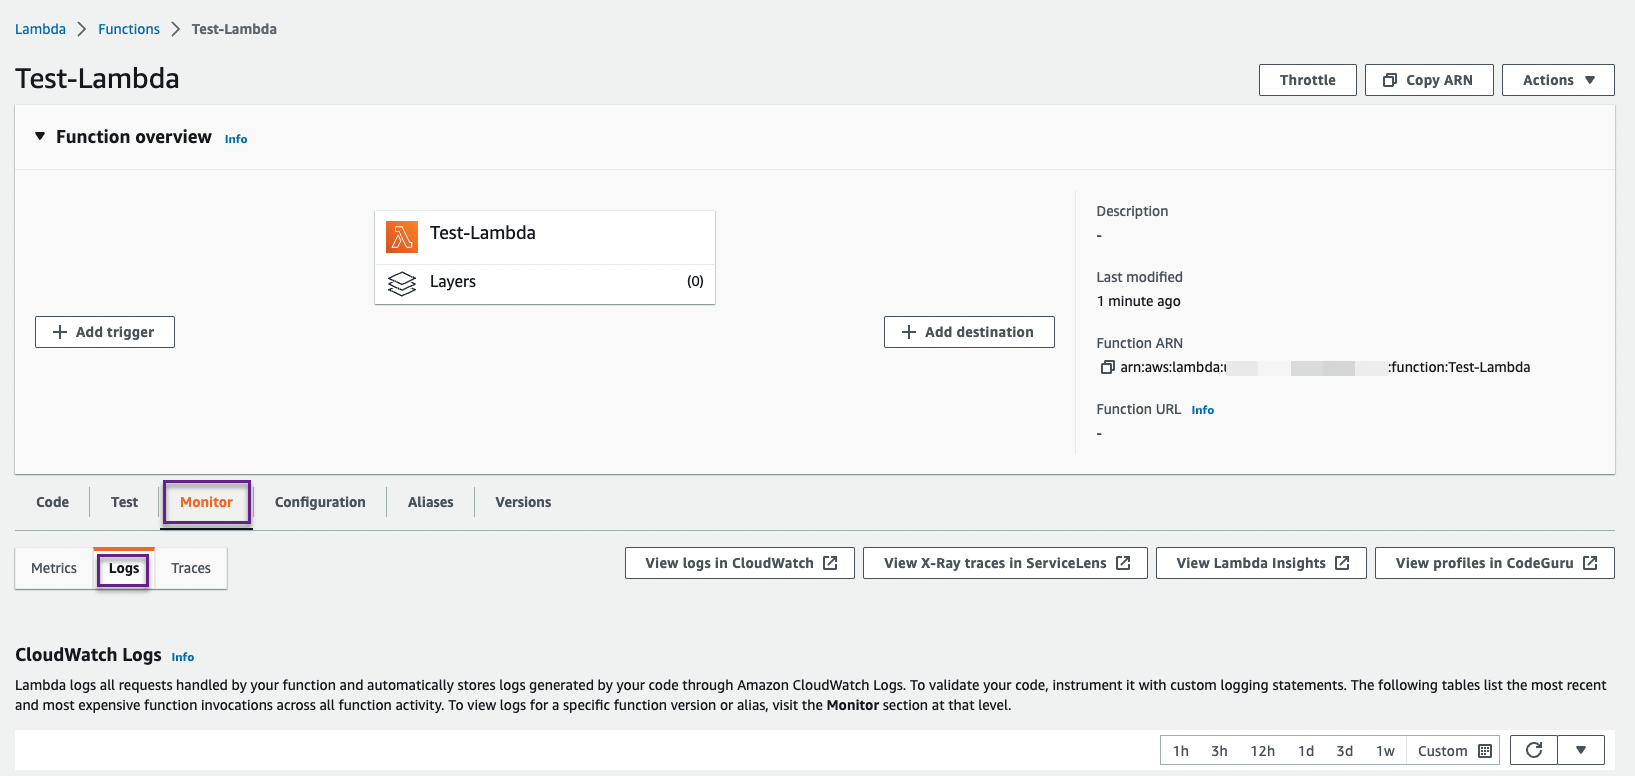
- Click View logs in CloudWatch.
- On the Subscription filters tab, click Create and select Create Lambda subscription filter.
- From the Lambda function drop-down menu, select the Lambda function you want to subscribe to the filter.
In our example, this is
aws-cold-start-lambda-function. - From the Log format drop-down menu, select JSON.
-
In the Subscription filter pattern text box, enter the following snippet.
[ report_label=REPORT, request_id_label=RequestId*, request_id_value, duration_label=Duration*, lambda_duration_ms, duration_unit=ms, billed_duration_label1=Billed, bill_duration_label2=Duration*, lambda_billed_duration_ms, billed_duration_unit=ms, memory_size_label1=Memory, memory_size_label2=Size*, lambda_memory_size_mb, memory_size_unit=MB, max_memory_used_label1=Max, max_memory_used_label2=Memory, max_memory_used_label3=Used*, lambda_max_memory_used_mb, max_memory_used_unit=MB, init_duration_label1=Init, init_duration_label2=Duration*, lambda_init_duration_ms, init_duration_unit=ms ] - In the Subscription filter name text box, provide a name and click Start streaming.
-
Navigate to your product cluster and in the Metrics Browser search for the
aws.lambda.custom.initdurationmetric.Important: Theaws.lambda.custom.initdurationmetric starts flowing only when cold start happens.