If you notice anomalies on your metrics charts or see that a service on the application map has large latency value, use the Logs Browser to troubleshoot your issues.
- Only users with the Logs permission can view the Logs Browser.
- Our service does not support logs ingestion for the OpenTelemetry Protocol.
Get Started with the Logs Browser
The Logs Browser supports in-depth exploration of your logs. As a user with the Logs permission, you can zoom into a time window, and you can filter and search your logs, so that you see exactly what you’re interested in.
To use the Logs Browser:
- Configure your application and the log shipper to send logs.
- In a web browser, log in to your product instance as user with the Logs permission.
- On the toolbar, click Logs > Log Browser.
On the Logs Browser, you can filter and examine logs for a selected period.
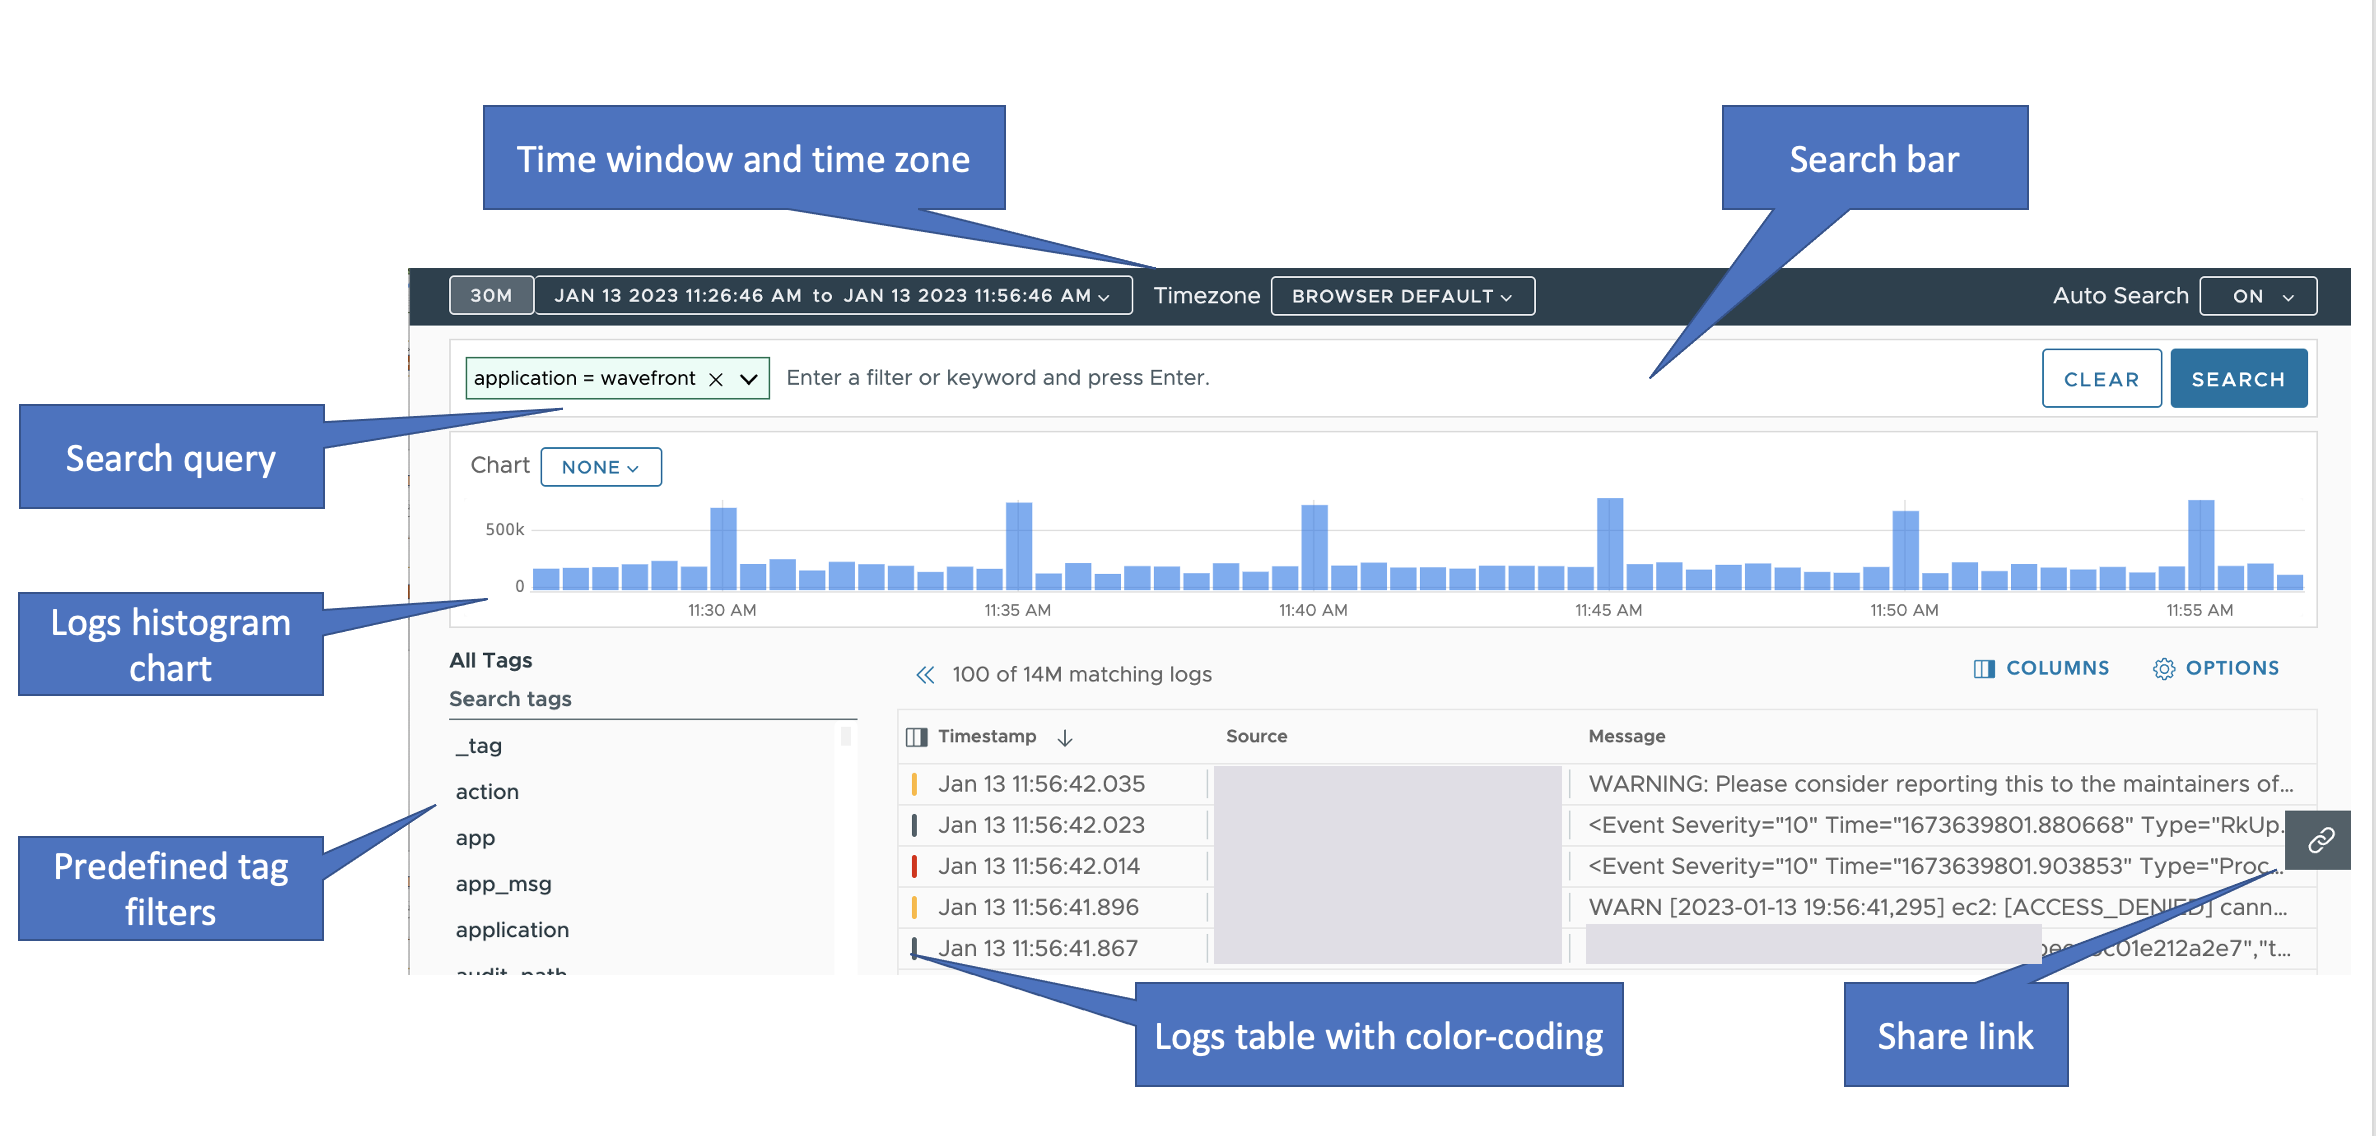
- From the toolbar, you can set the time window and the time zone for which you want to filter the logs.
- From the predefined Source and All Tags filters, you can select tag key-value pairs that you want to include or exclude from the logs search results. The include and exclude filters that you select are added to the search query in the search bar.
- In the search bar, you can directly enter include and exclude filters and add them to the search query.
- The logs chart shows how many logs matching the search query were sent in each time bucket for the selected time window. You can zoom in on smaller time windows. You can also group the number of logs by the values of a particular tag.
-
The logs table lists the logs matching the search query for the selected time window. You can click a log to see the log message. Each log is classified by one of the following colors.
Color Description 
Logs that have the term
warnorwarning.
Logs that have the term
debugortrace. Light theme
 Dark theme
Logs that have the term
errororcritical. Light theme
 Dark theme
Logs that have the term
info. Light theme
 Dark theme
Unclassified logs that don't have any of the above terms.
- From the Link button on the left, you can copy and share a link to your current logs search query.
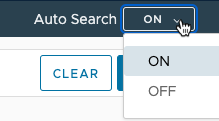
Enable or Disable Auto-Search
When auto-search is OFF, after you change the time window or the search query, to get the search results, you must click Search . Otherwise, the search runs each time you change the time window or the search query, but that might slow things down.
To enable or disable auto-search:
|
|
Set the Time Window
You can narrow down the logs list to show only logs from a particular time window.
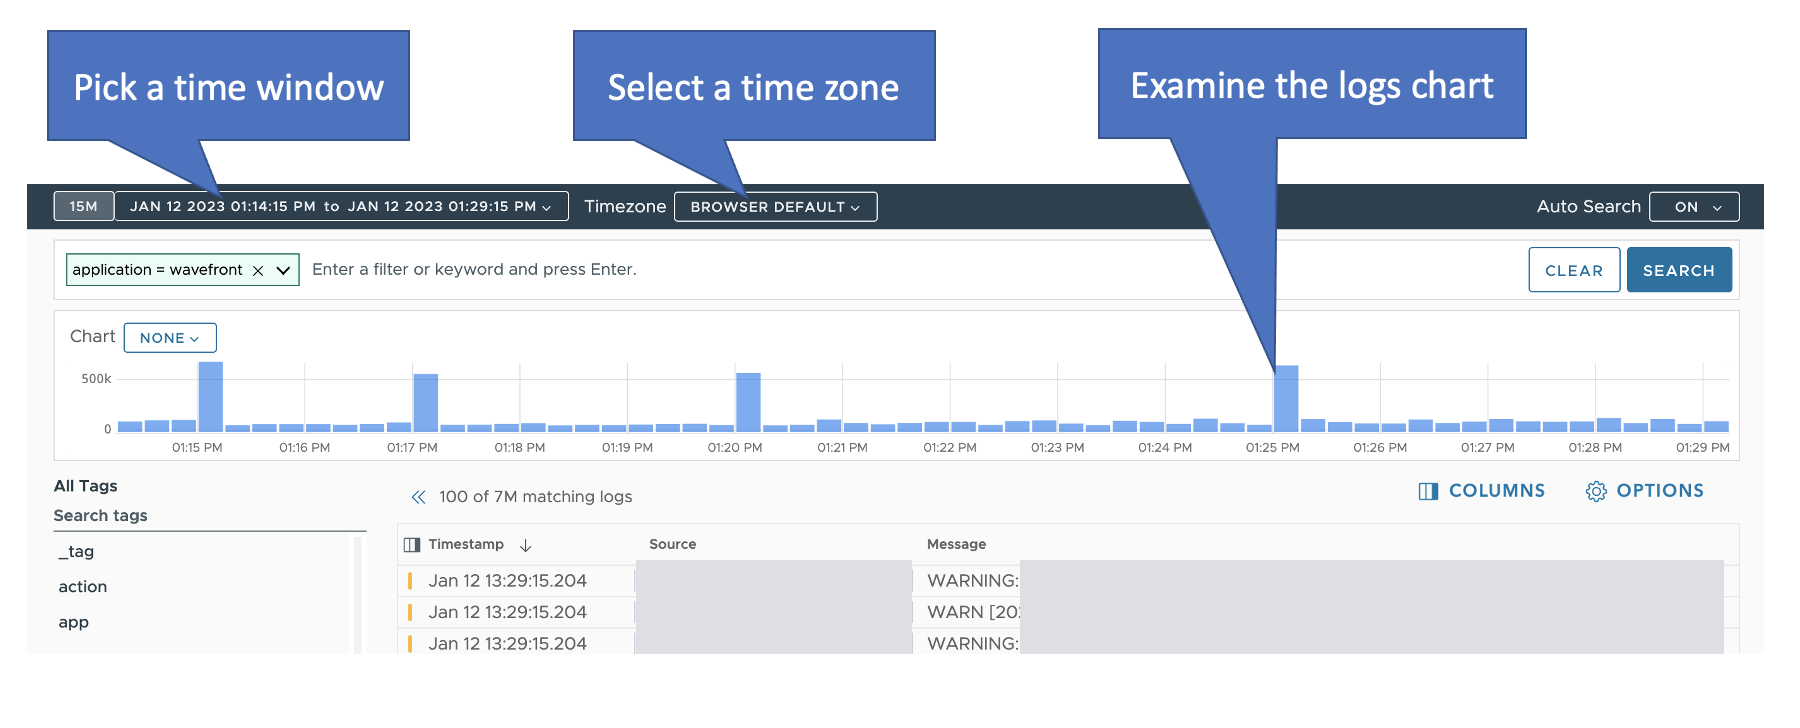
- From the Time window picker, you can select either a preset time or custom start and end dates and times.
- From the Timezone drop-down menu, you can select your preferred time zone, so that the timestamp values of the logs convert to the time zone that you selected.
- After you get the first search results, you can examine the logs chart and further adjust the time window. See Drill Down from the Logs Chart.
Each time you change the time window, the predefined Source and All Tags filters update to show only the tag values that exist within the selected time window.
If auto-search is OFF, after you change the time window, you must click Search to update the logs table and the logs chart to show only the logs with timestamp values within the selected time window.
Build Your Search Query
To narrow down the logs list and show only the logs that match certain criteria, you can build and run a search query in the search bar. The search query consists of one or more filter expressions.
AND. The logical operators between the filters of the same type are described in the following table.Filter Types and Logical Operators
| Filter Expression | Description |
|---|---|
<tag_key> = <tag_value>
|
Include tag filter, which retrieves only the logs that have the specified tag key-value pair.
For example, if you add the following combination of filters: |
<tag_key> != <tag_value>
|
Exclude tag filter, which retrieves only the logs that don't have the specified tag key-value pair. If you add multiple exclude tag filters, the logical operator between them is For example, if you add the following combination of filters: |
message = <keyword>
|
Include message filter, which retrieves only the logs that have the specified If you add multiple include message filters, the logical operator between them is For example, if you add the following combination of filters: |
message != <keyword>
|
Exclude message filter, which retrieves only the logs that don't have the specified If you add multiple exclude message filters, the logical operator between them is For example, if you add the following combination of filters: |
You can add search filters from the predefined filters in the left panel and from the log viewer. You can also directly enter filter expressions in the search bar.
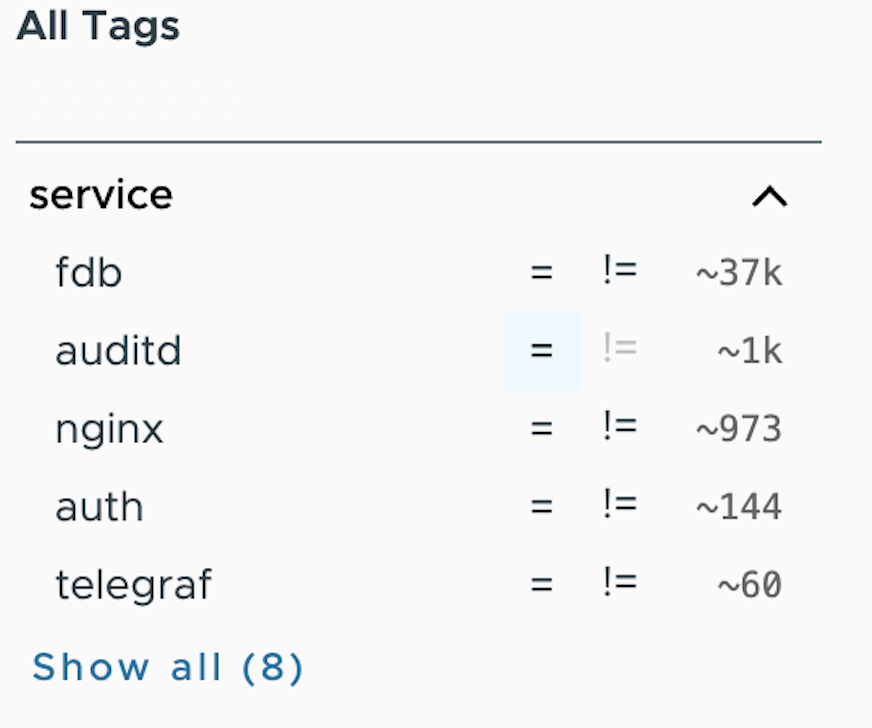
Add a Tag Filter
|
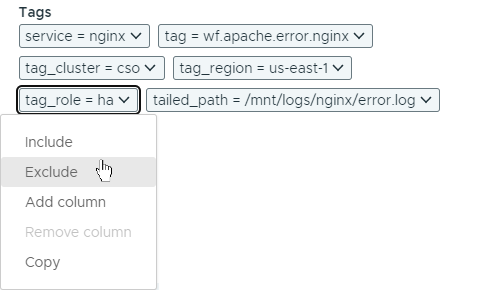
To add a tag filter from a predefined filter:
|
|
|
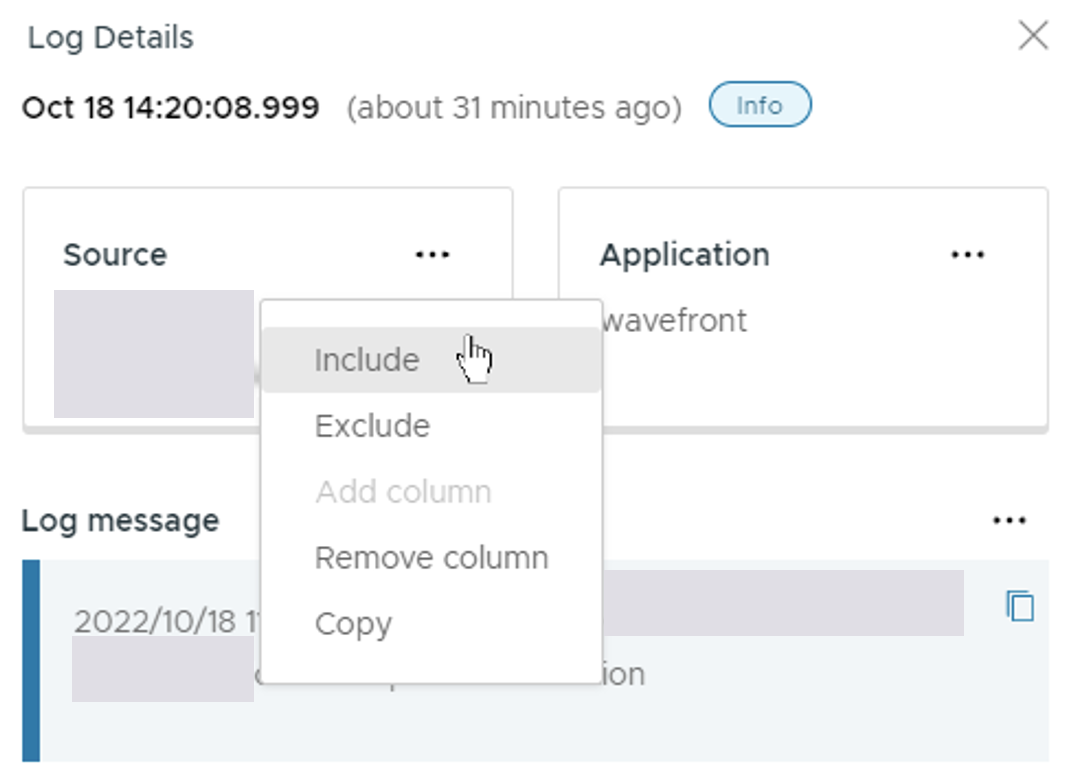
To add a tag filter from the Log Details window:
|
|
source tag filter from the predefined filter or from the log viewer. To add a subsequent source tag filter, you must enter the entire filter expression in the search bar. For example, in the search bar, enter source=dc2 and press Enter.Add a Message Filter
|
To add a message filter from the Log Details window:
|
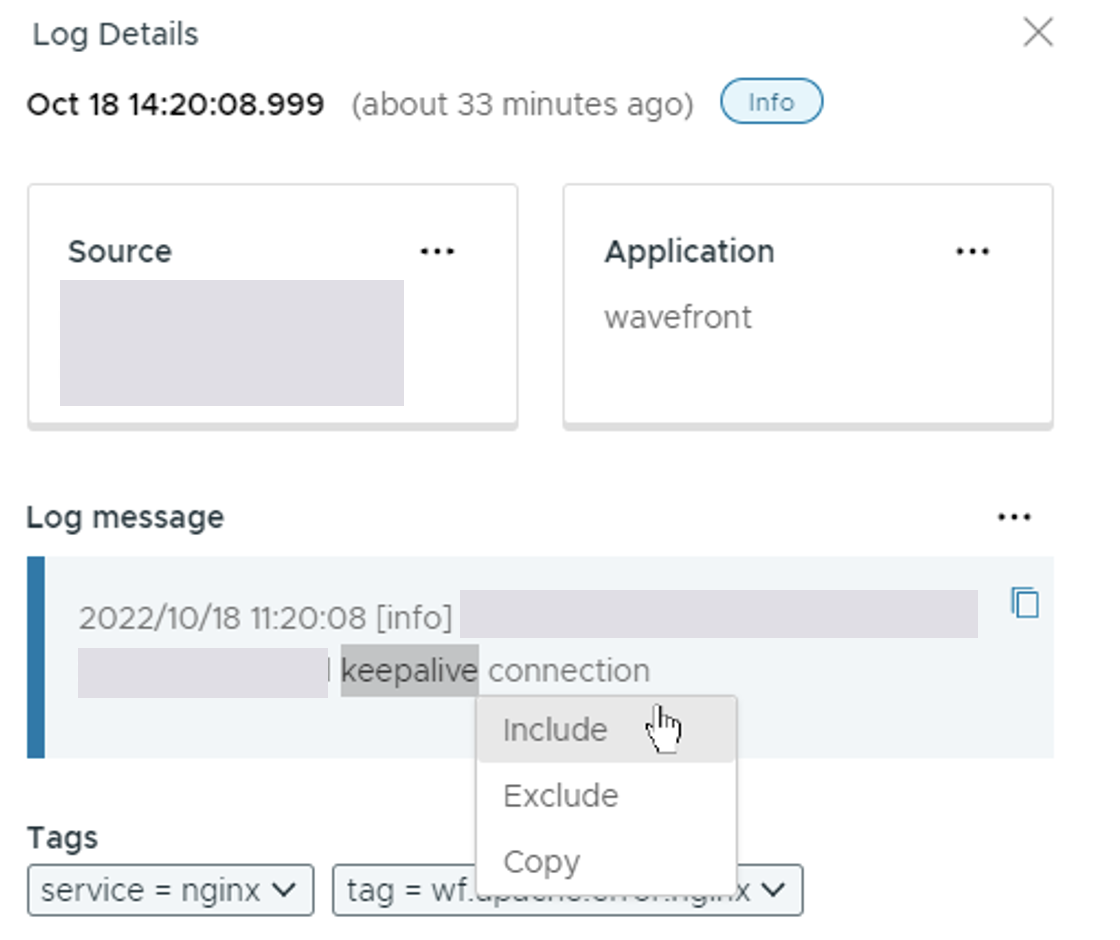
|
|
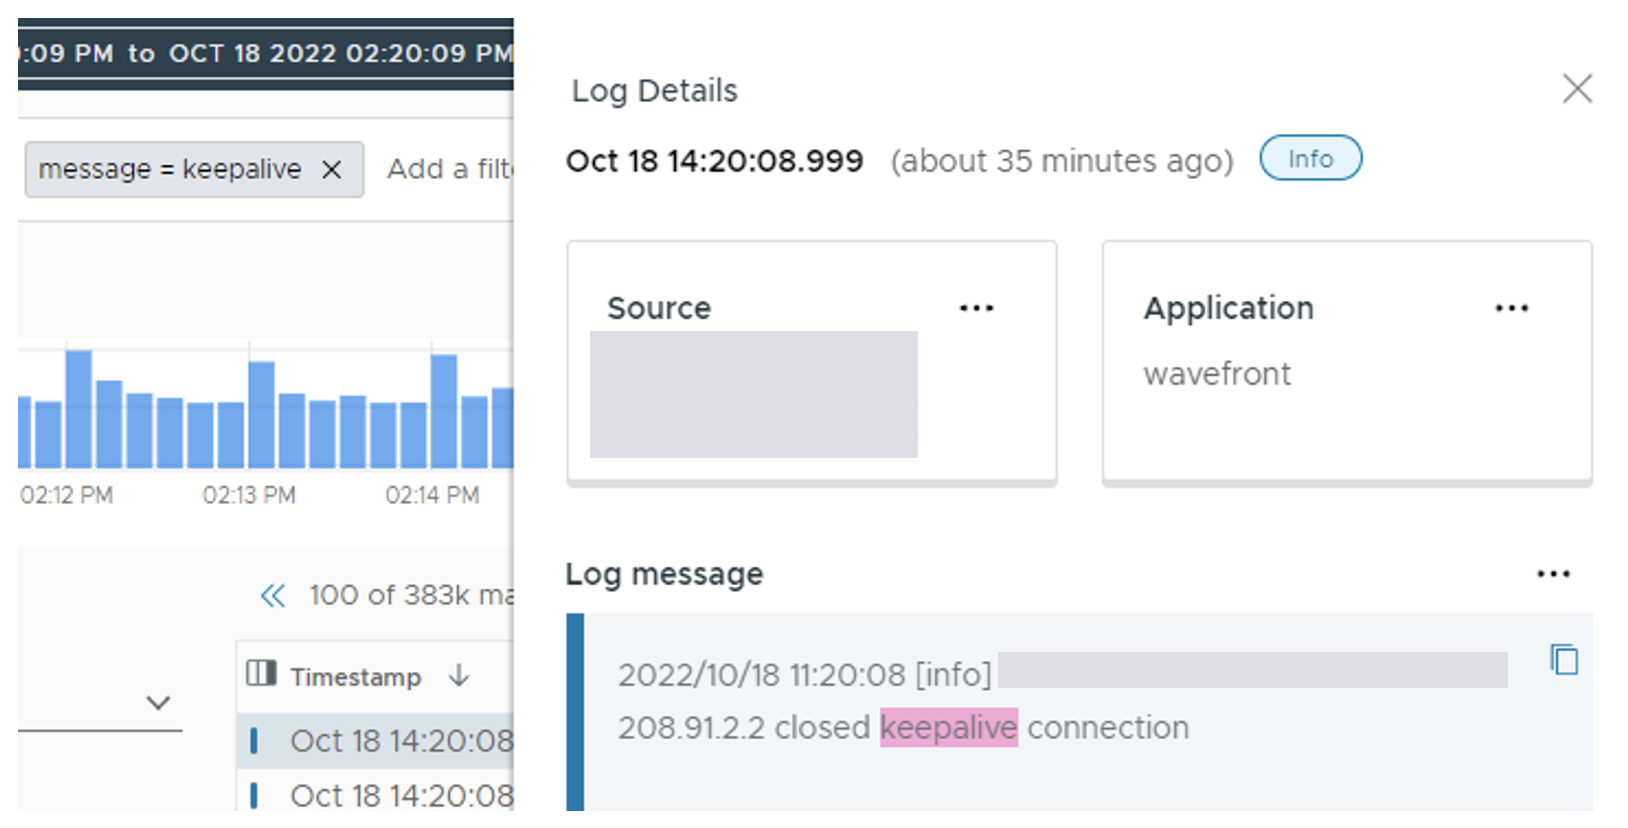
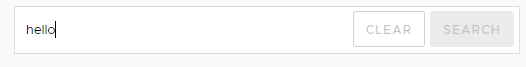
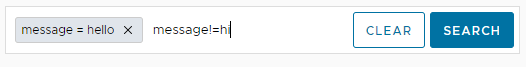
To add a message filter directly in the search bar:
If you want to directly add an exclude message filter, enter the entire filter expression, for example, |
|
|
The keywords that you searched are highlighted in the log messages. |
|
Edit or Delete a Search Filter
To edit or delete a search filter:
|
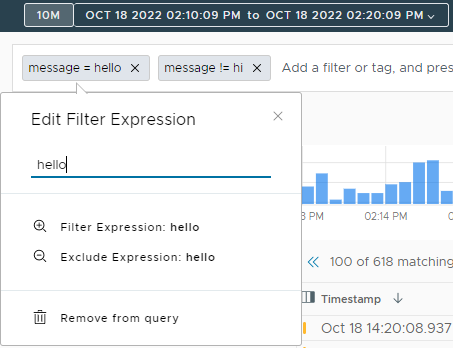
|
Drill Down from the Logs Chart
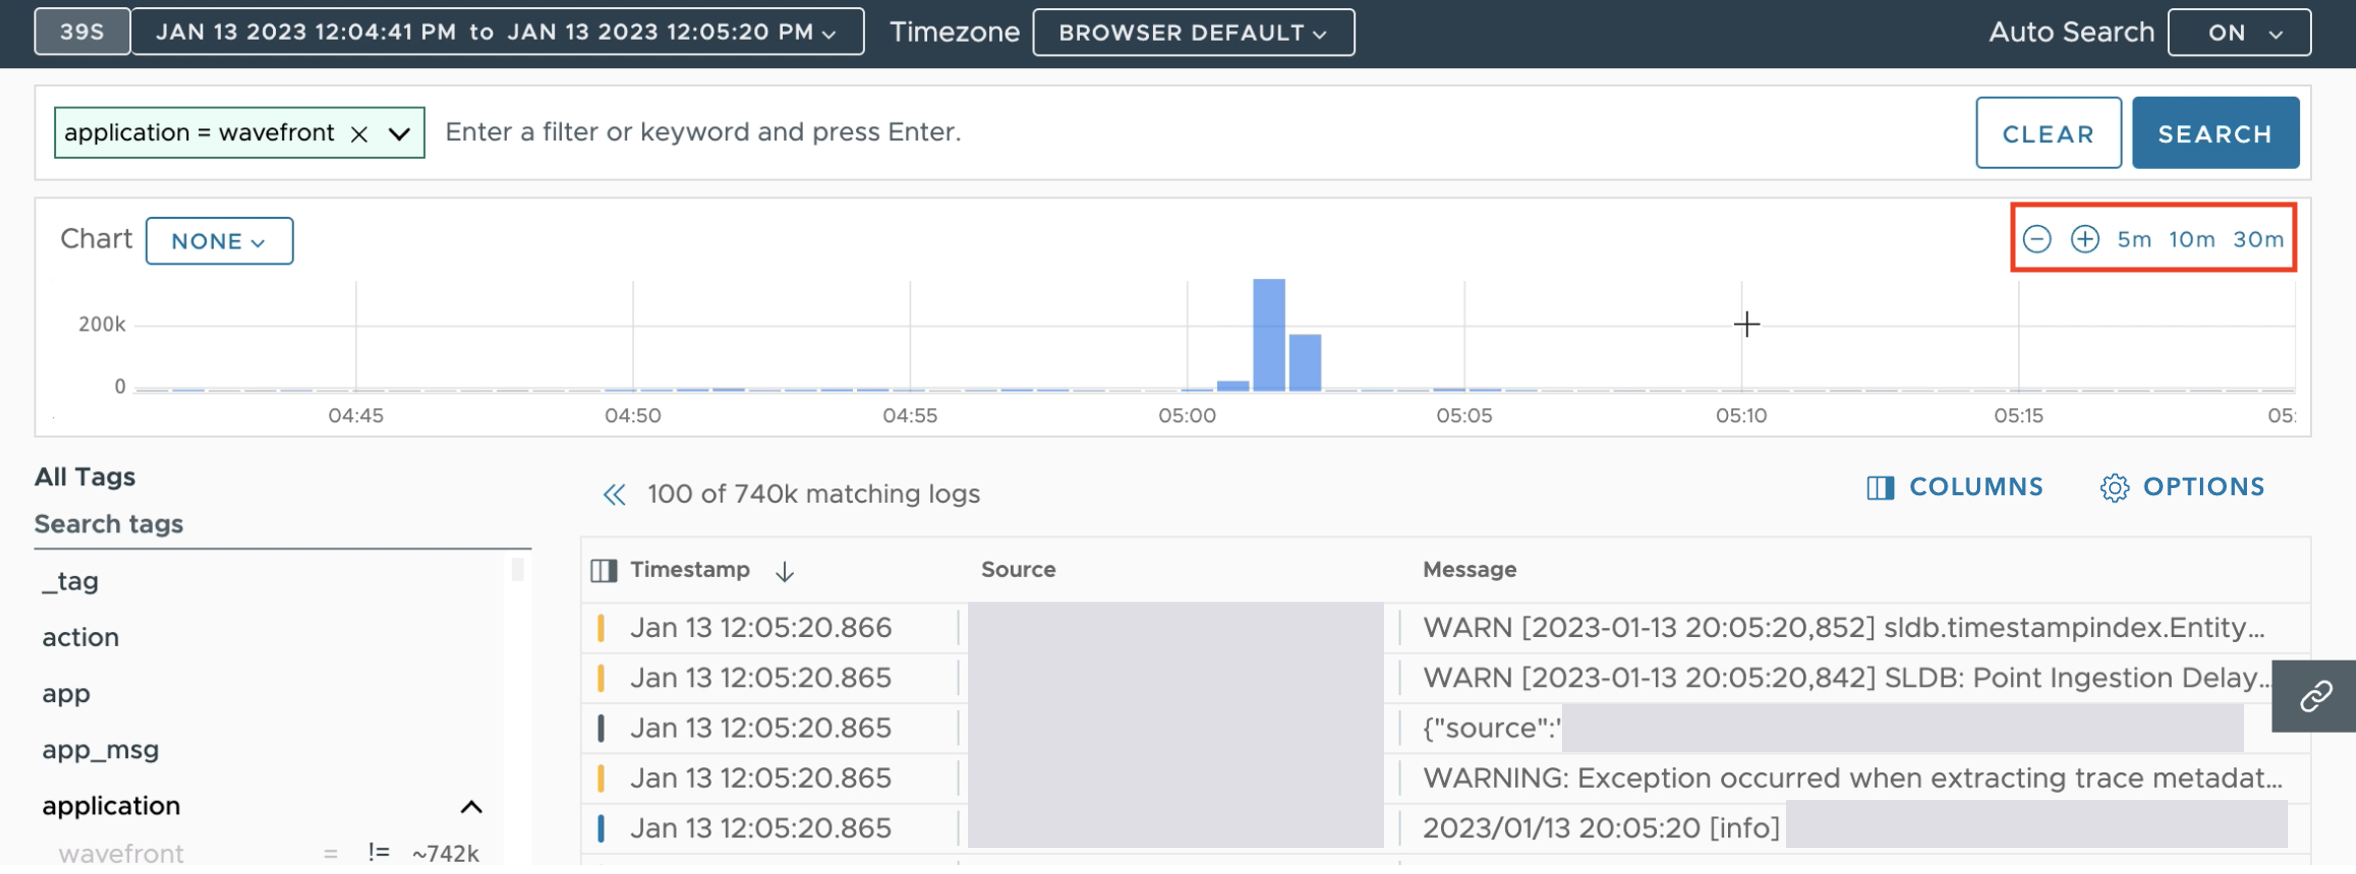
The chart at the top of the Logs Browser shows the number of logs distributed over the selected time window. The chart consists of 60 buckets. With a 15-minute time window, each bar on the chart shows the number of logs for each 15-second time interval.
If you notice a spike, which means that more logs were sent, you can zoom in on the chart to examine the data. As you zoom in, the logs table below the chart shows the data for the new time window.
Let’s look at an example:
-
In the screenshot below, the logs chart has three spikes. If you want to zoom into the time window of the last spike, drag-select the area of interest and, if auto-search is off, click Search.
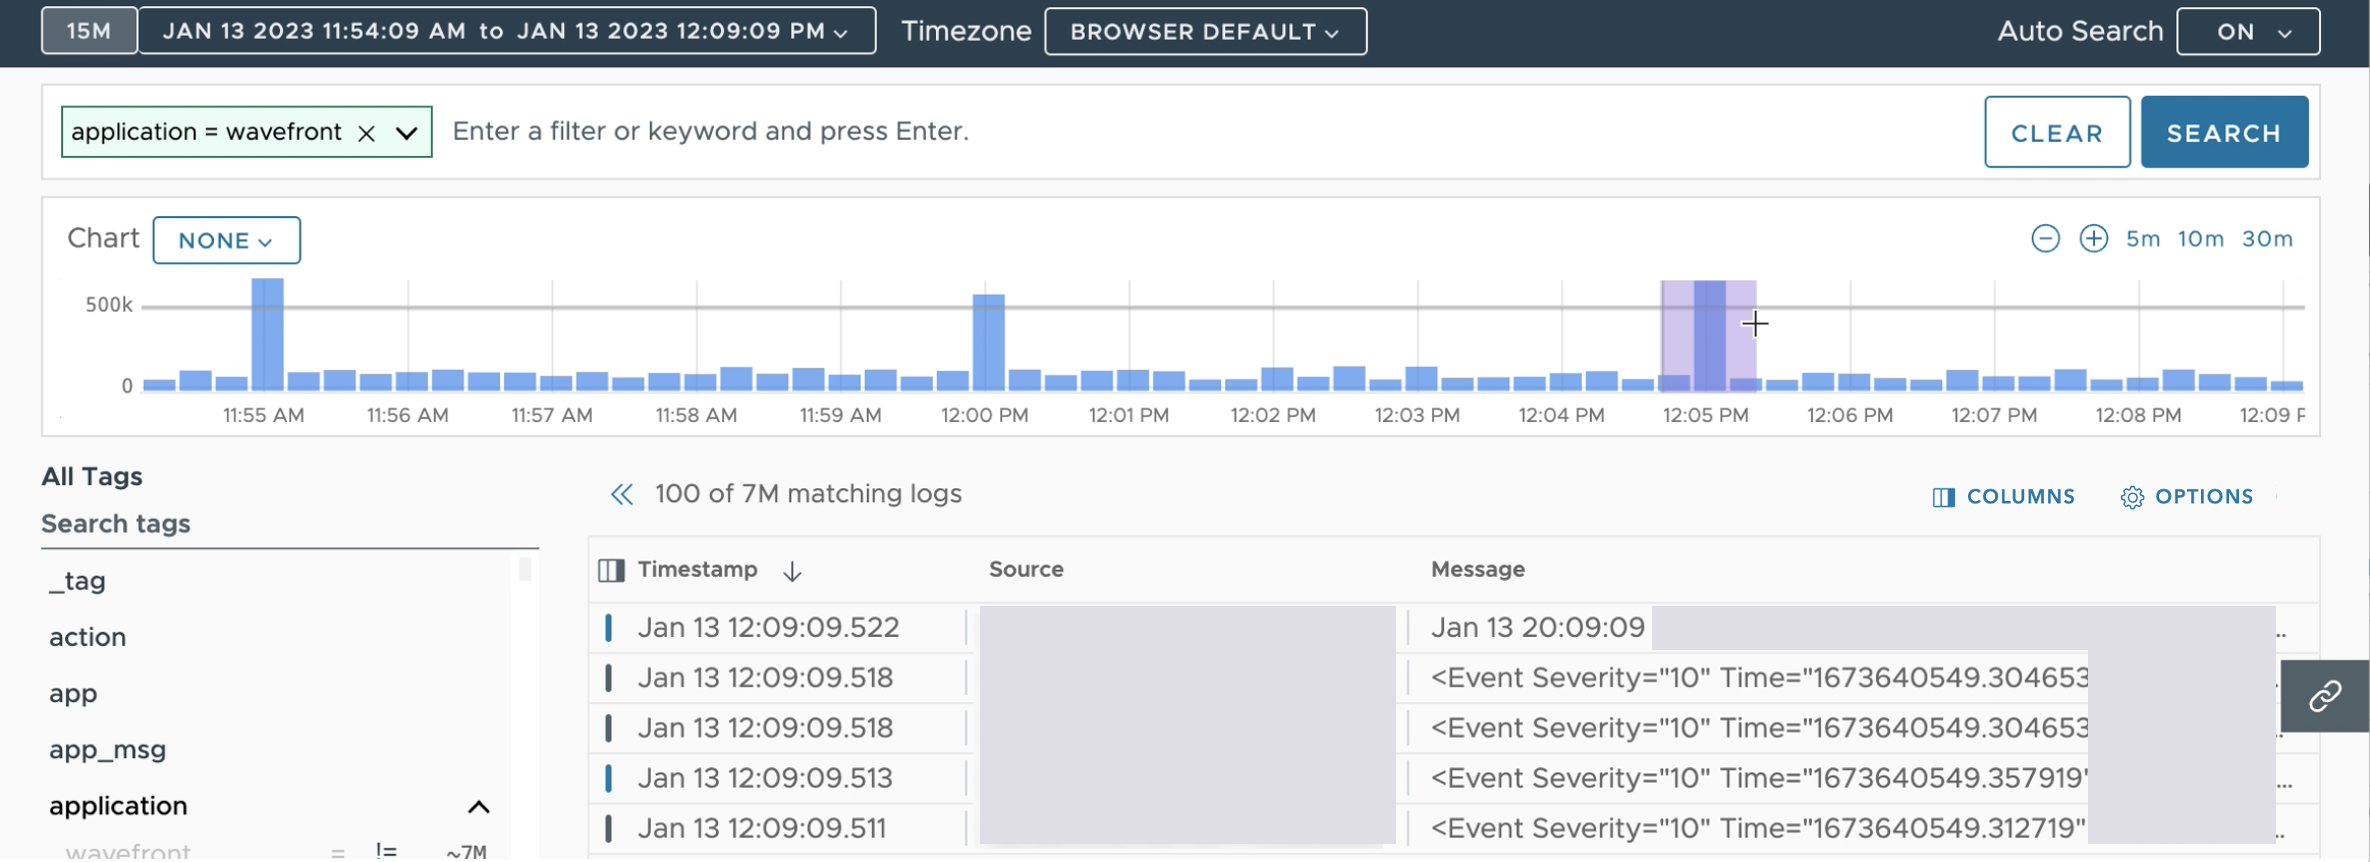
The logs chart shows the data for the zoomed-in time window and the logs table is updated so that it shows the logs from the new time window.
-
Hover over the area above the right side of the logs chart, click the plus (+) icon to zoom in further as needed and, if auto-search is off, click Search.
-
To group the logs in the logs chart by the values of a particular tag key, from the Charts drop-down menu, select the grouping tag key. The legend explains which color maps to which value of the grouping tag key.
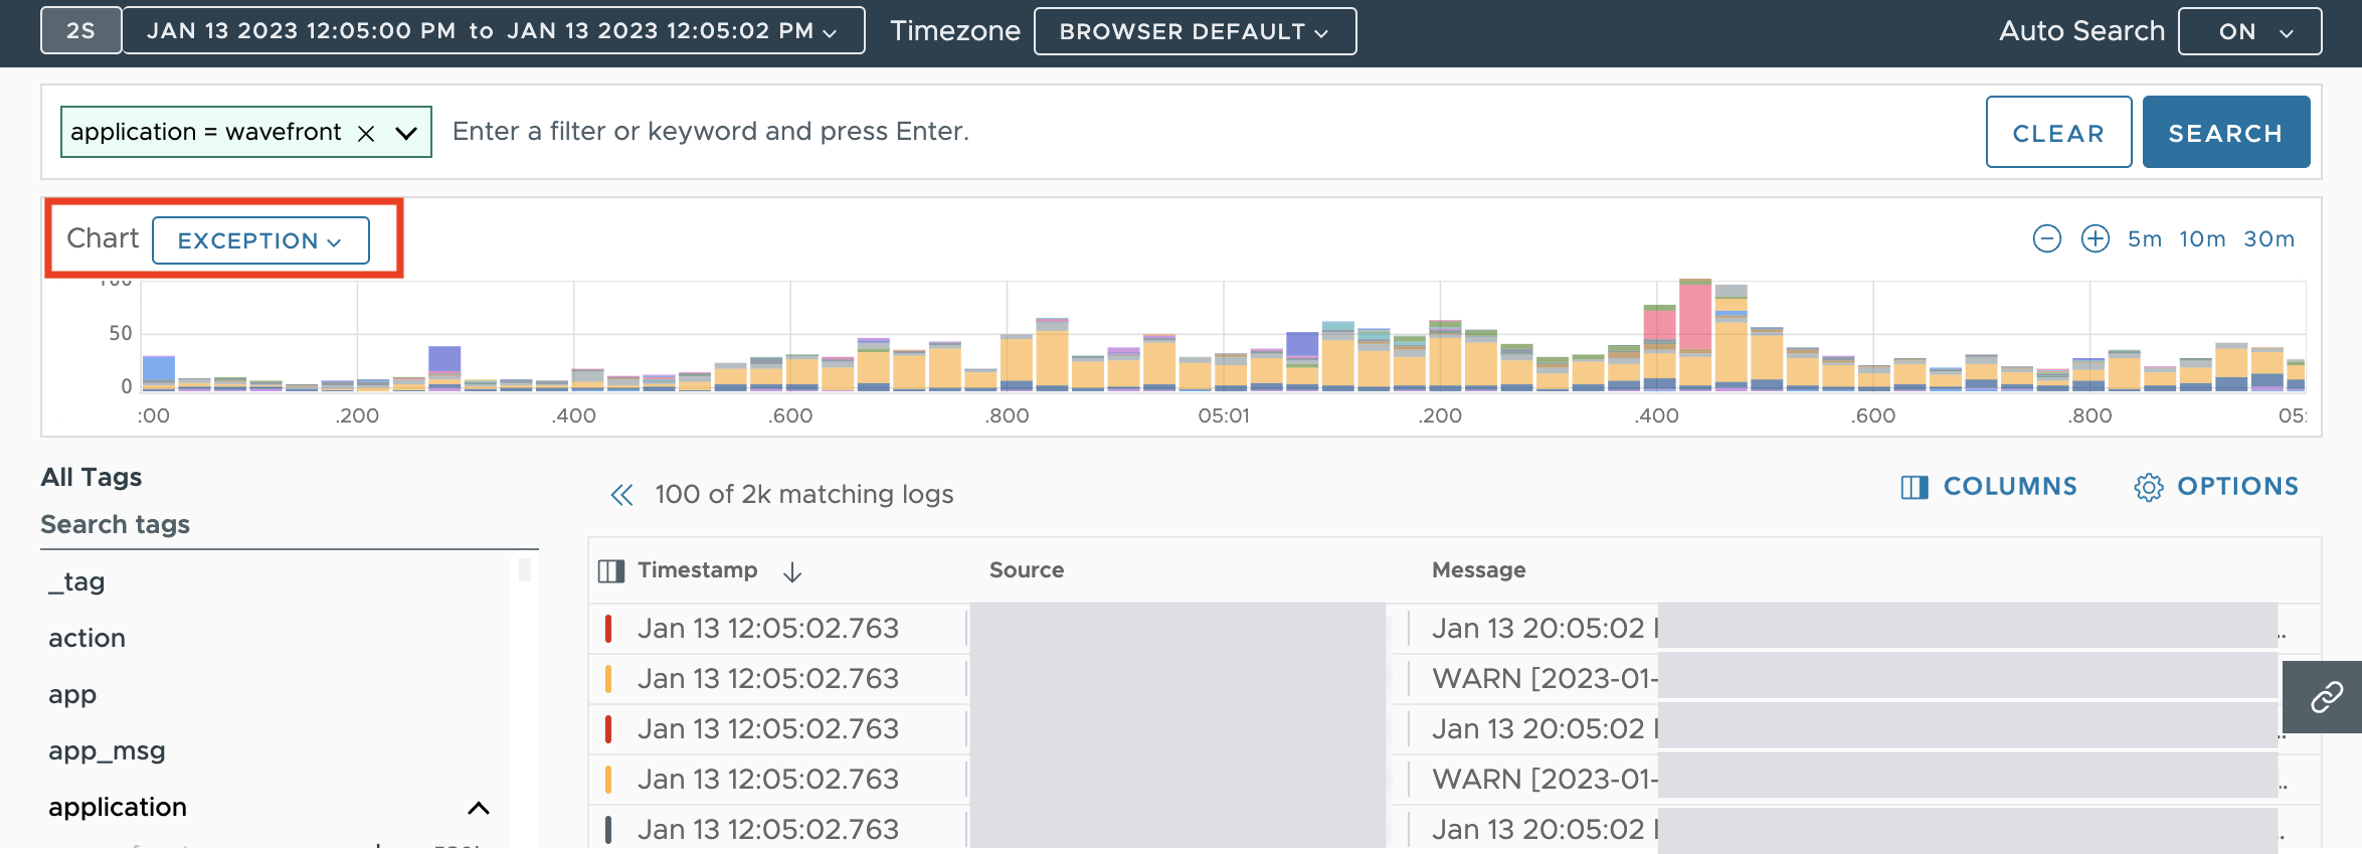 Note: The logs that don’t have the grouping tag are excluded from the logs chart. The logs table doesn’t update by the selected grouping tag key.
Customize the Logs Details Table
Add or Remove Columns
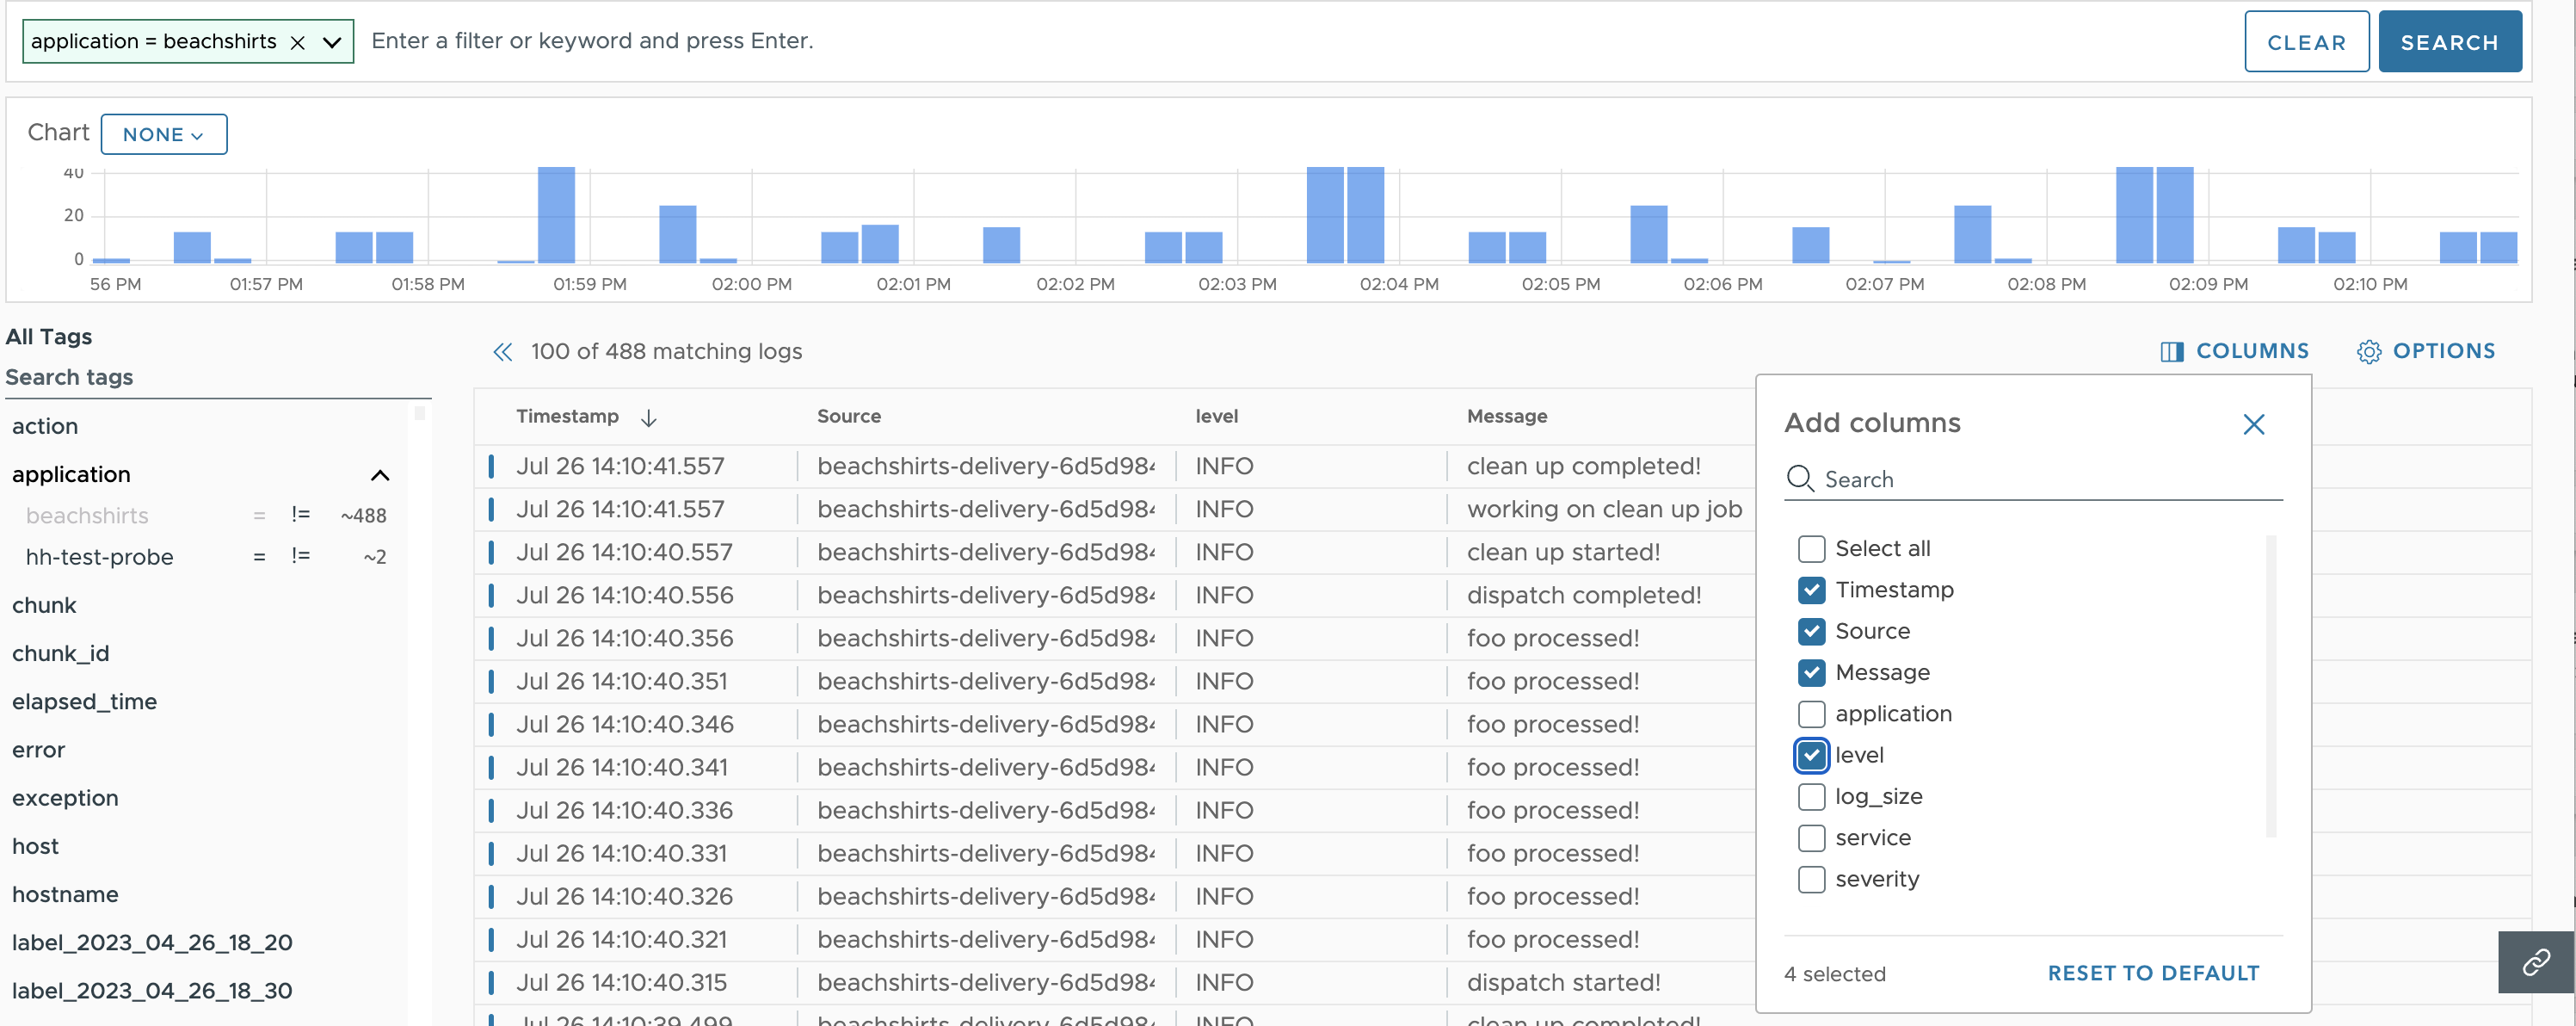
The logs details table has the Timestamp, Source, and Message columns by default. Follow these steps to add columns.
- Click the add columns icon in the top right of the table.
- Select the columns that you want to add. The options you see are the tags you defined during log shipper configuration.
Here’s an example that shows how to add the level column to the table.
Change the Number of Lines per Row
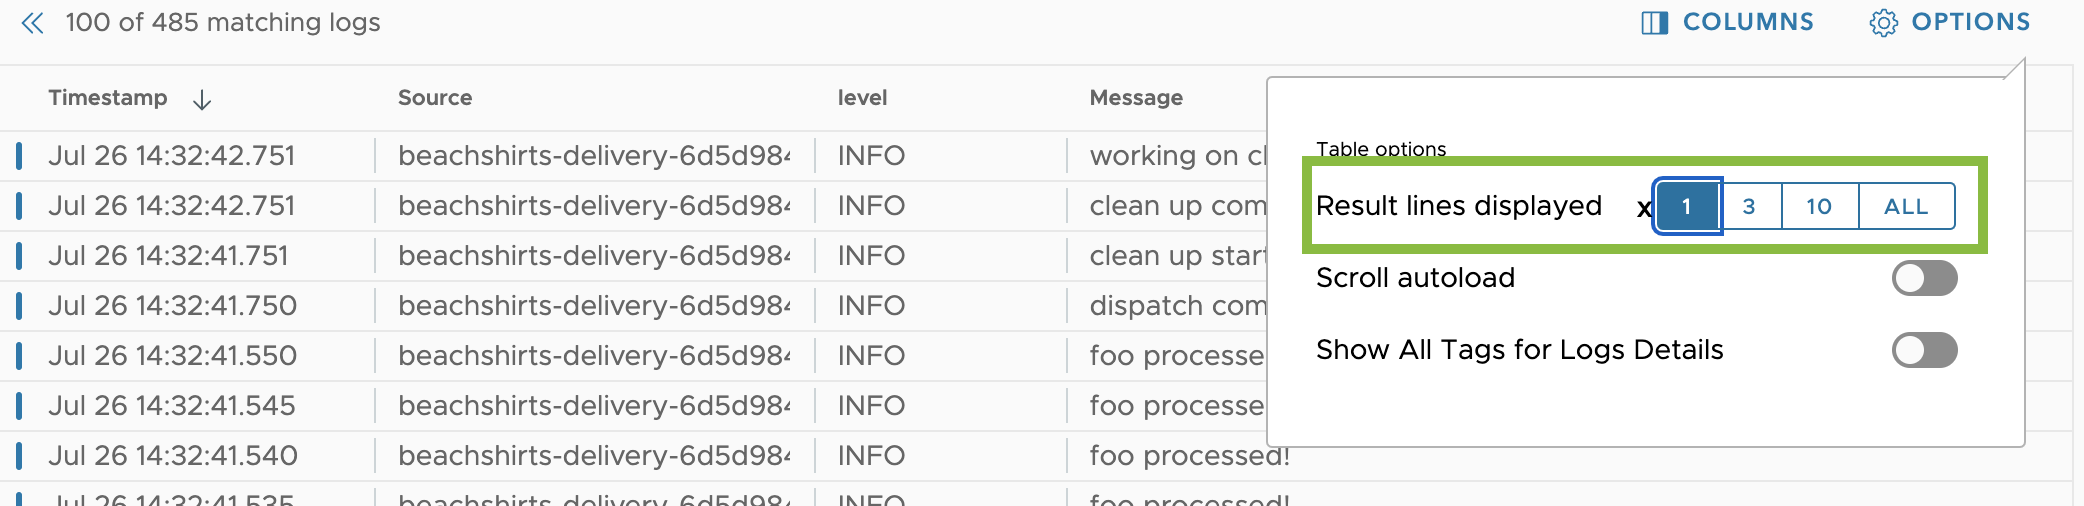
By default, the logs details table shows one line per row, that is, per log. If you want to see bigger previews of the log messages, to increase the number of lines per row:
- Click Options above the logs table (top right).
-
From the Results line display options, select the maximum number of lines that you want to show for each log.
The options are 1, 3, 10, and All lines per log.
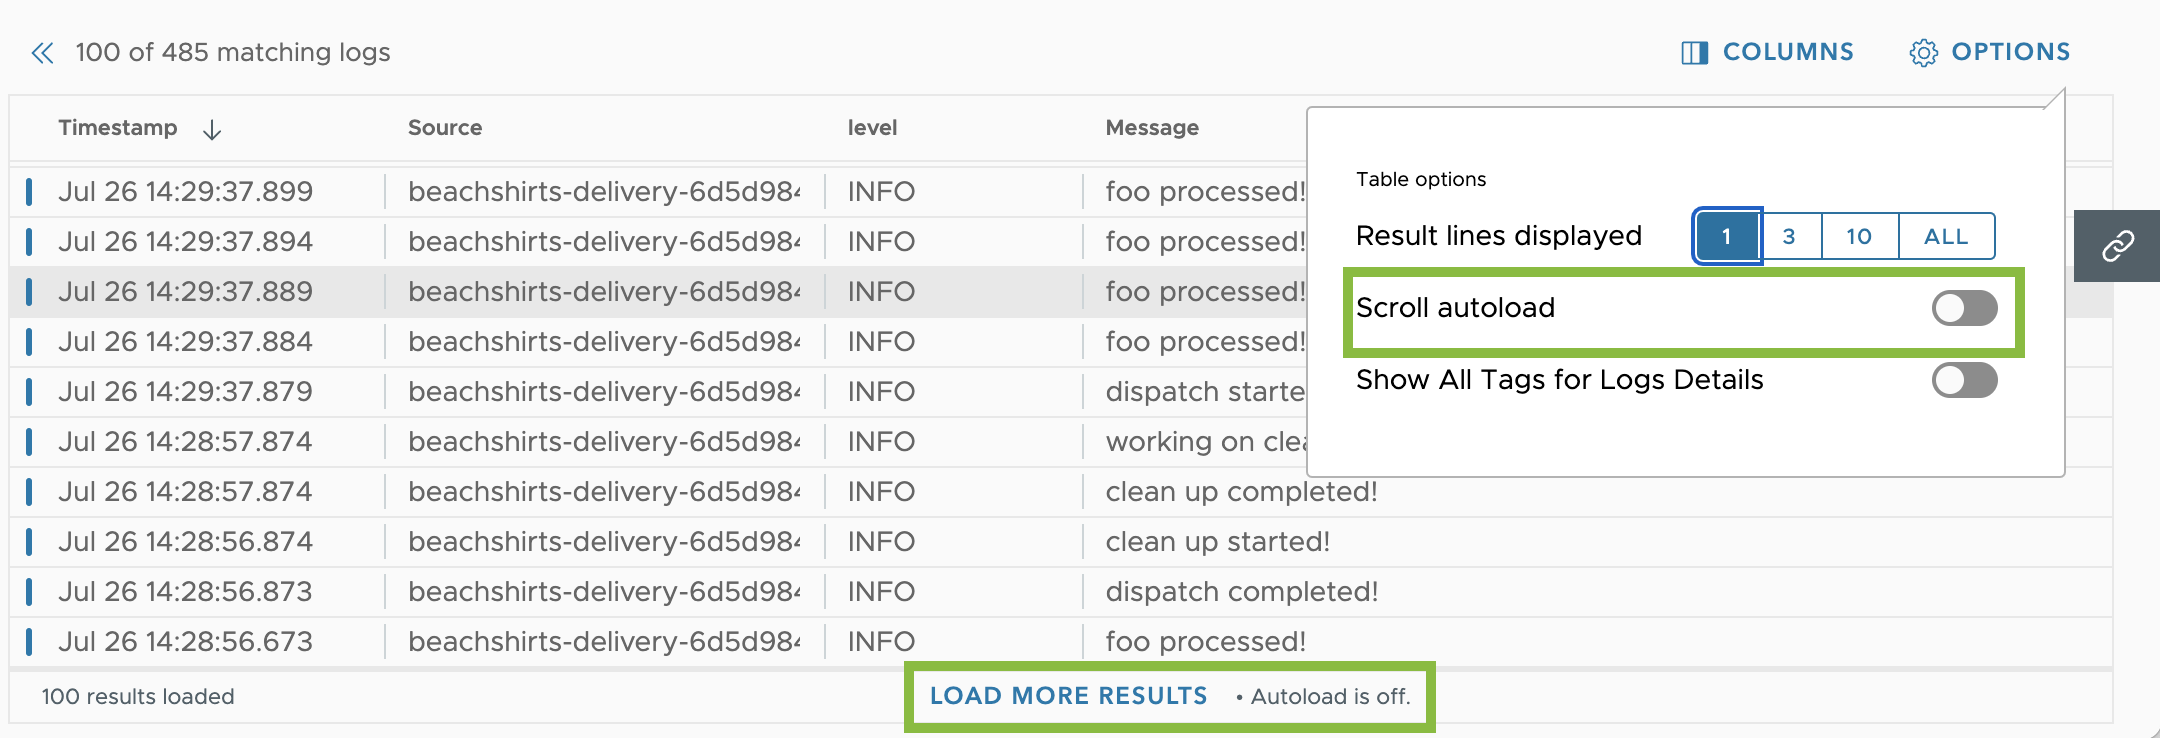
Enable or Disable Auto-Load During Scroll
When you search and filter logs, you can decide how you want to load the results in the logs table.
By default, scroll auto-load is enabled and logs load as you scroll through the logs table. If scroll auto-load is disabled, to load the next set of results, you must click Load More Results.
To disable scroll auto-load:
- Click Options above the logs table (top right).
- Turn off Scroll Auto-Load.
Learn More!
- Get started with logs.
- Send logs.
- Learn about the proxy configurations and proxy preprocessor rules for logs.
- Create logs alerts on your logs data.
- See Logs troubleshooting.