Tanzu Observability (formerly known as VMware Aria Operations for Applications) includes the Operation Dashboard, which you can use to identify potential hot spots in each operation, such as the GET operation of the beachshirts application’s shopping service. From the Operation Dashboard you can then drill down to the Traces Browser.
Explore the Default Operation Dashboard
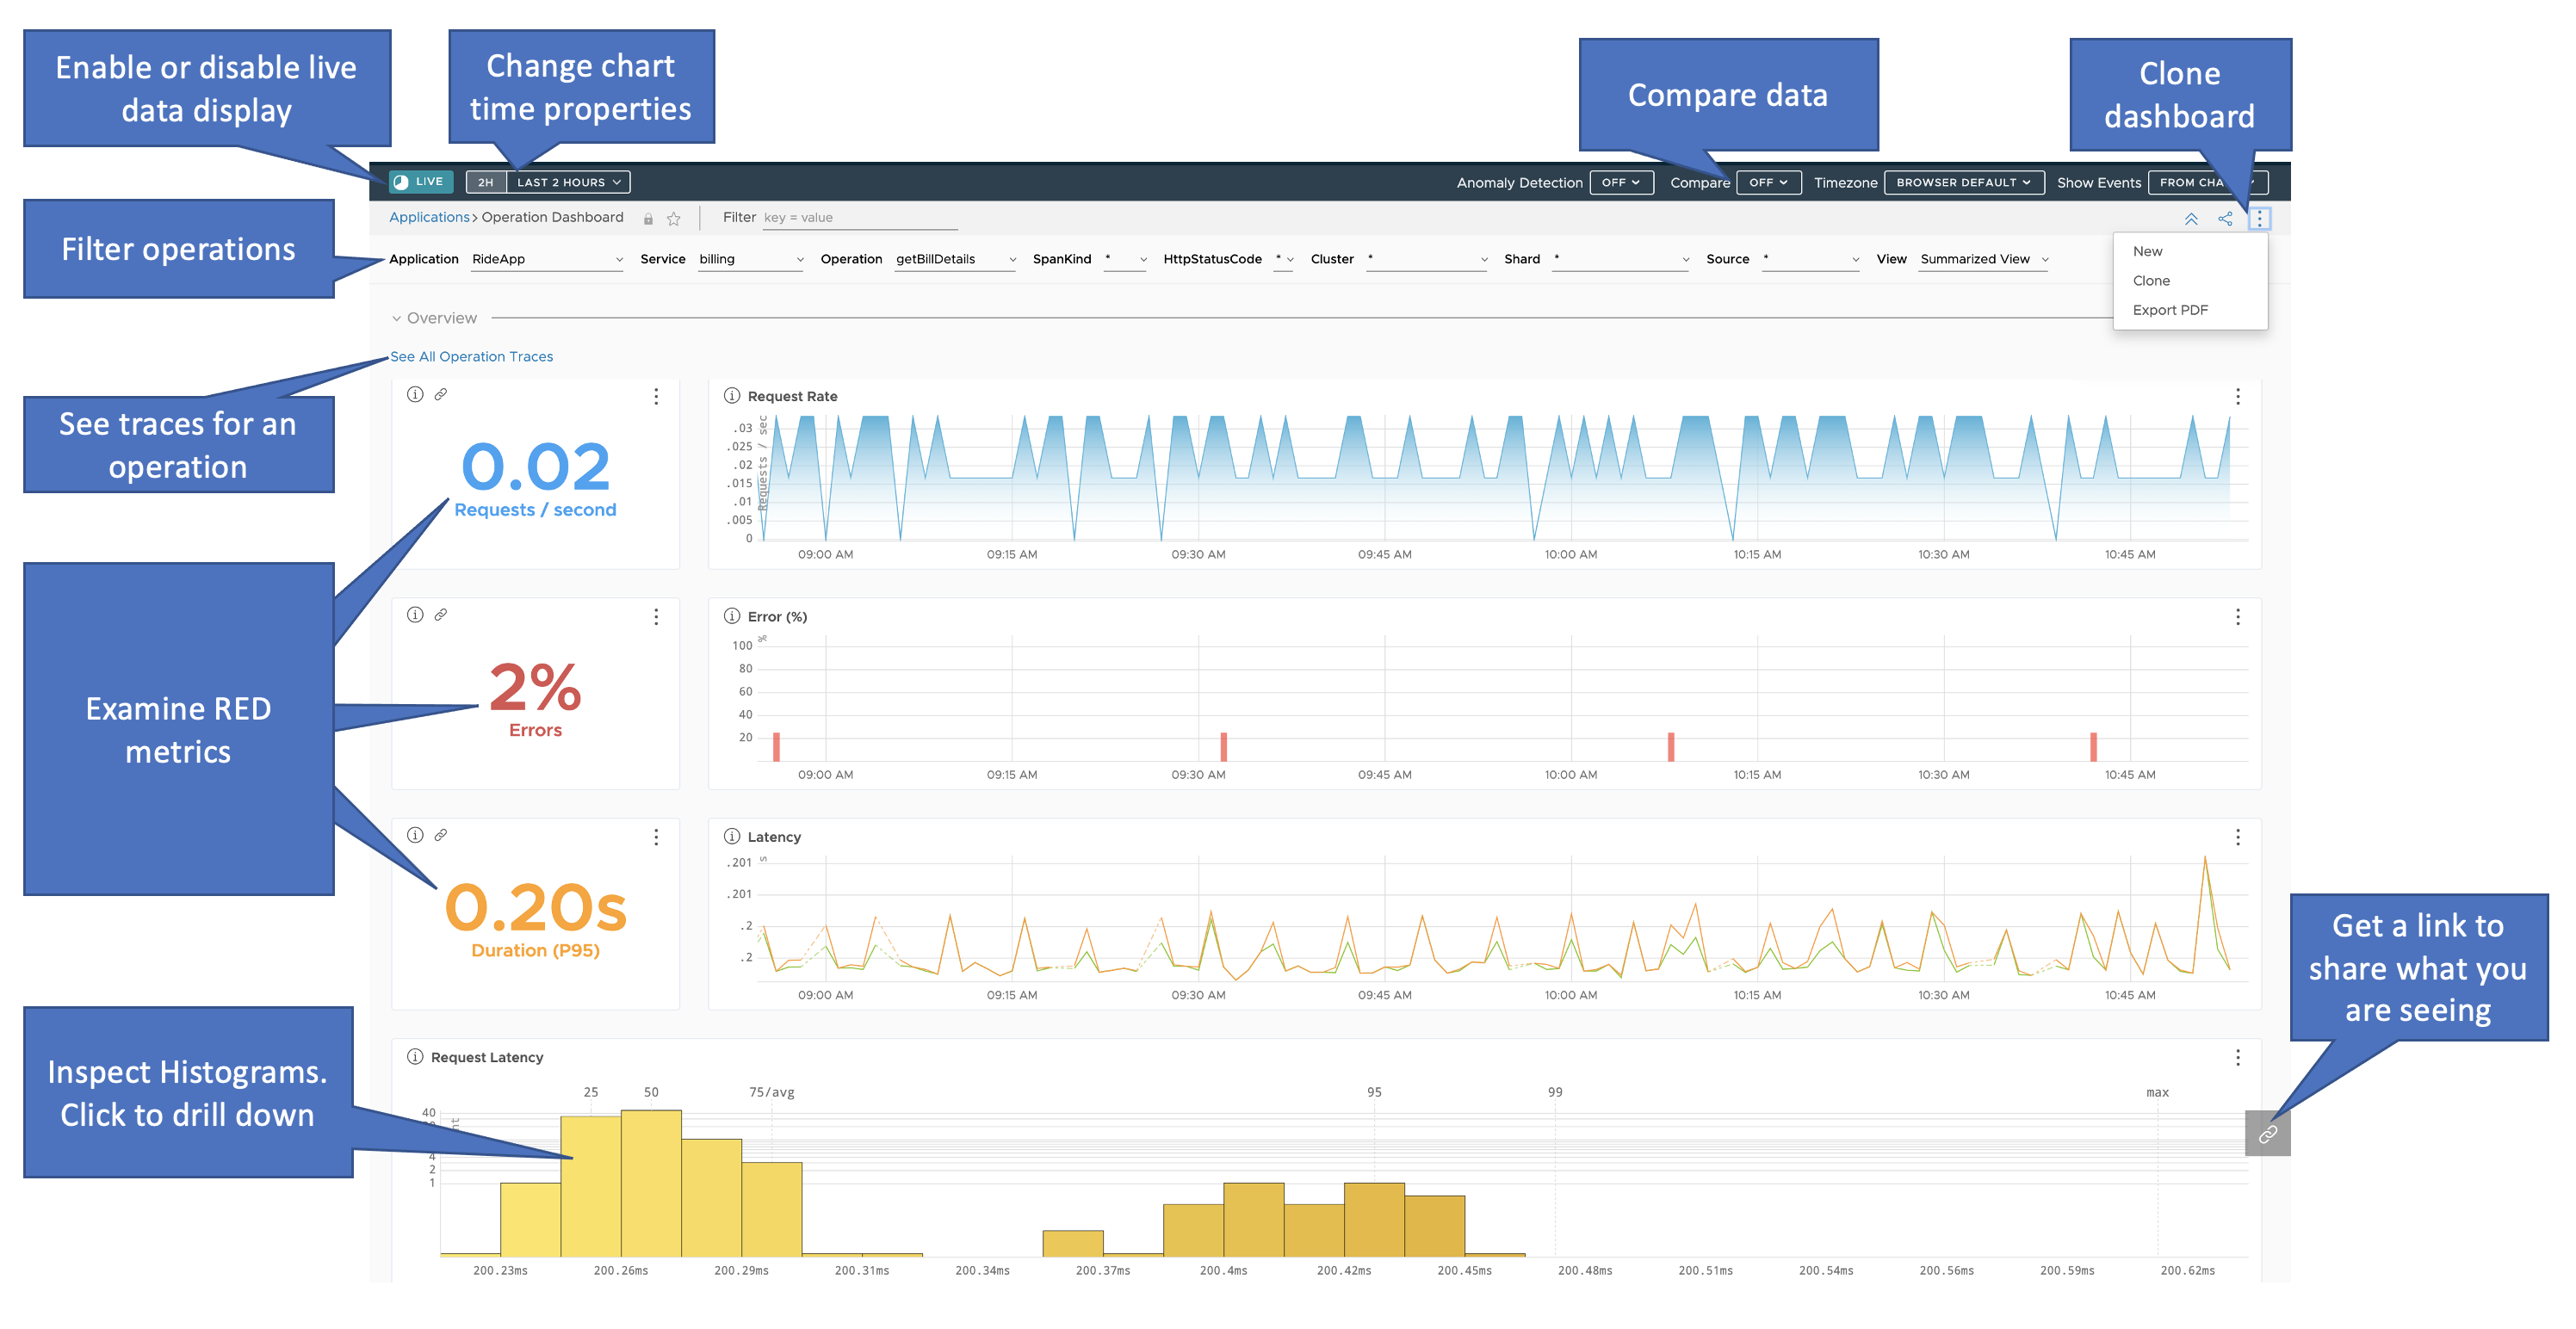
The default, read-only dashboard lets you explore RED metrics of an operation, however, you can’t make changes to the dashboard.
See the Operation Dashboard:
- Option 1:
- Log in to your service instance.
- From the toolbar, select Applications > Operation Dashboard.
-
Option 2: Drill down to the Operation Dashboard from the tracing traffic on the application map.
- Option 3: Drill down to the Operation Dashboard from the traces browser, click on a trace, click on a span from a specific operation, and click Go to Operation Dashboard.
On the dashboard for a particular service, you can:
- Select the time and time zone in the toolbar to customize the chart time properties.
- Filter the metrics based on the operation, application, service, spankind, HTTP status code, cluster, shard, or source.
- Select Detailed View or Summarized View to change the level of detail for charts.
- Use
 to get a link and share what you’re seeing right now (NON-LIVE display) with other users.
 - Navigate to the Traces Browser.
- Click See all operation traces.
- Select a region of the histogram chart and click Search Traces to view the traces for the selected duration.
- Click the vertical ellipsis in the top right of any chart, click Traces, and click a service.
Note: If you don’t see Traces, check whether your metrics include
applicationandservice pointtags.
These tags are defined when you instrument your application for tracing via Application tags. If your application is already sending this data to the Operations for Applications service via the Wavefront proxy, you can add point tags using Wavefront proxy preprocessor rules.
Custom Operation Dashboard
The standard dashboard for operations is read-only. To create a customizable copy:
- Click the ellipsis icon and select Clone.
- In the cloned dashboard, add your own charts or customize the RED metrics charts.
After you save the clone, click Dashboard on the toolbar and search for your dashboard by its name. You can use it to drill down to the Traces Browser.
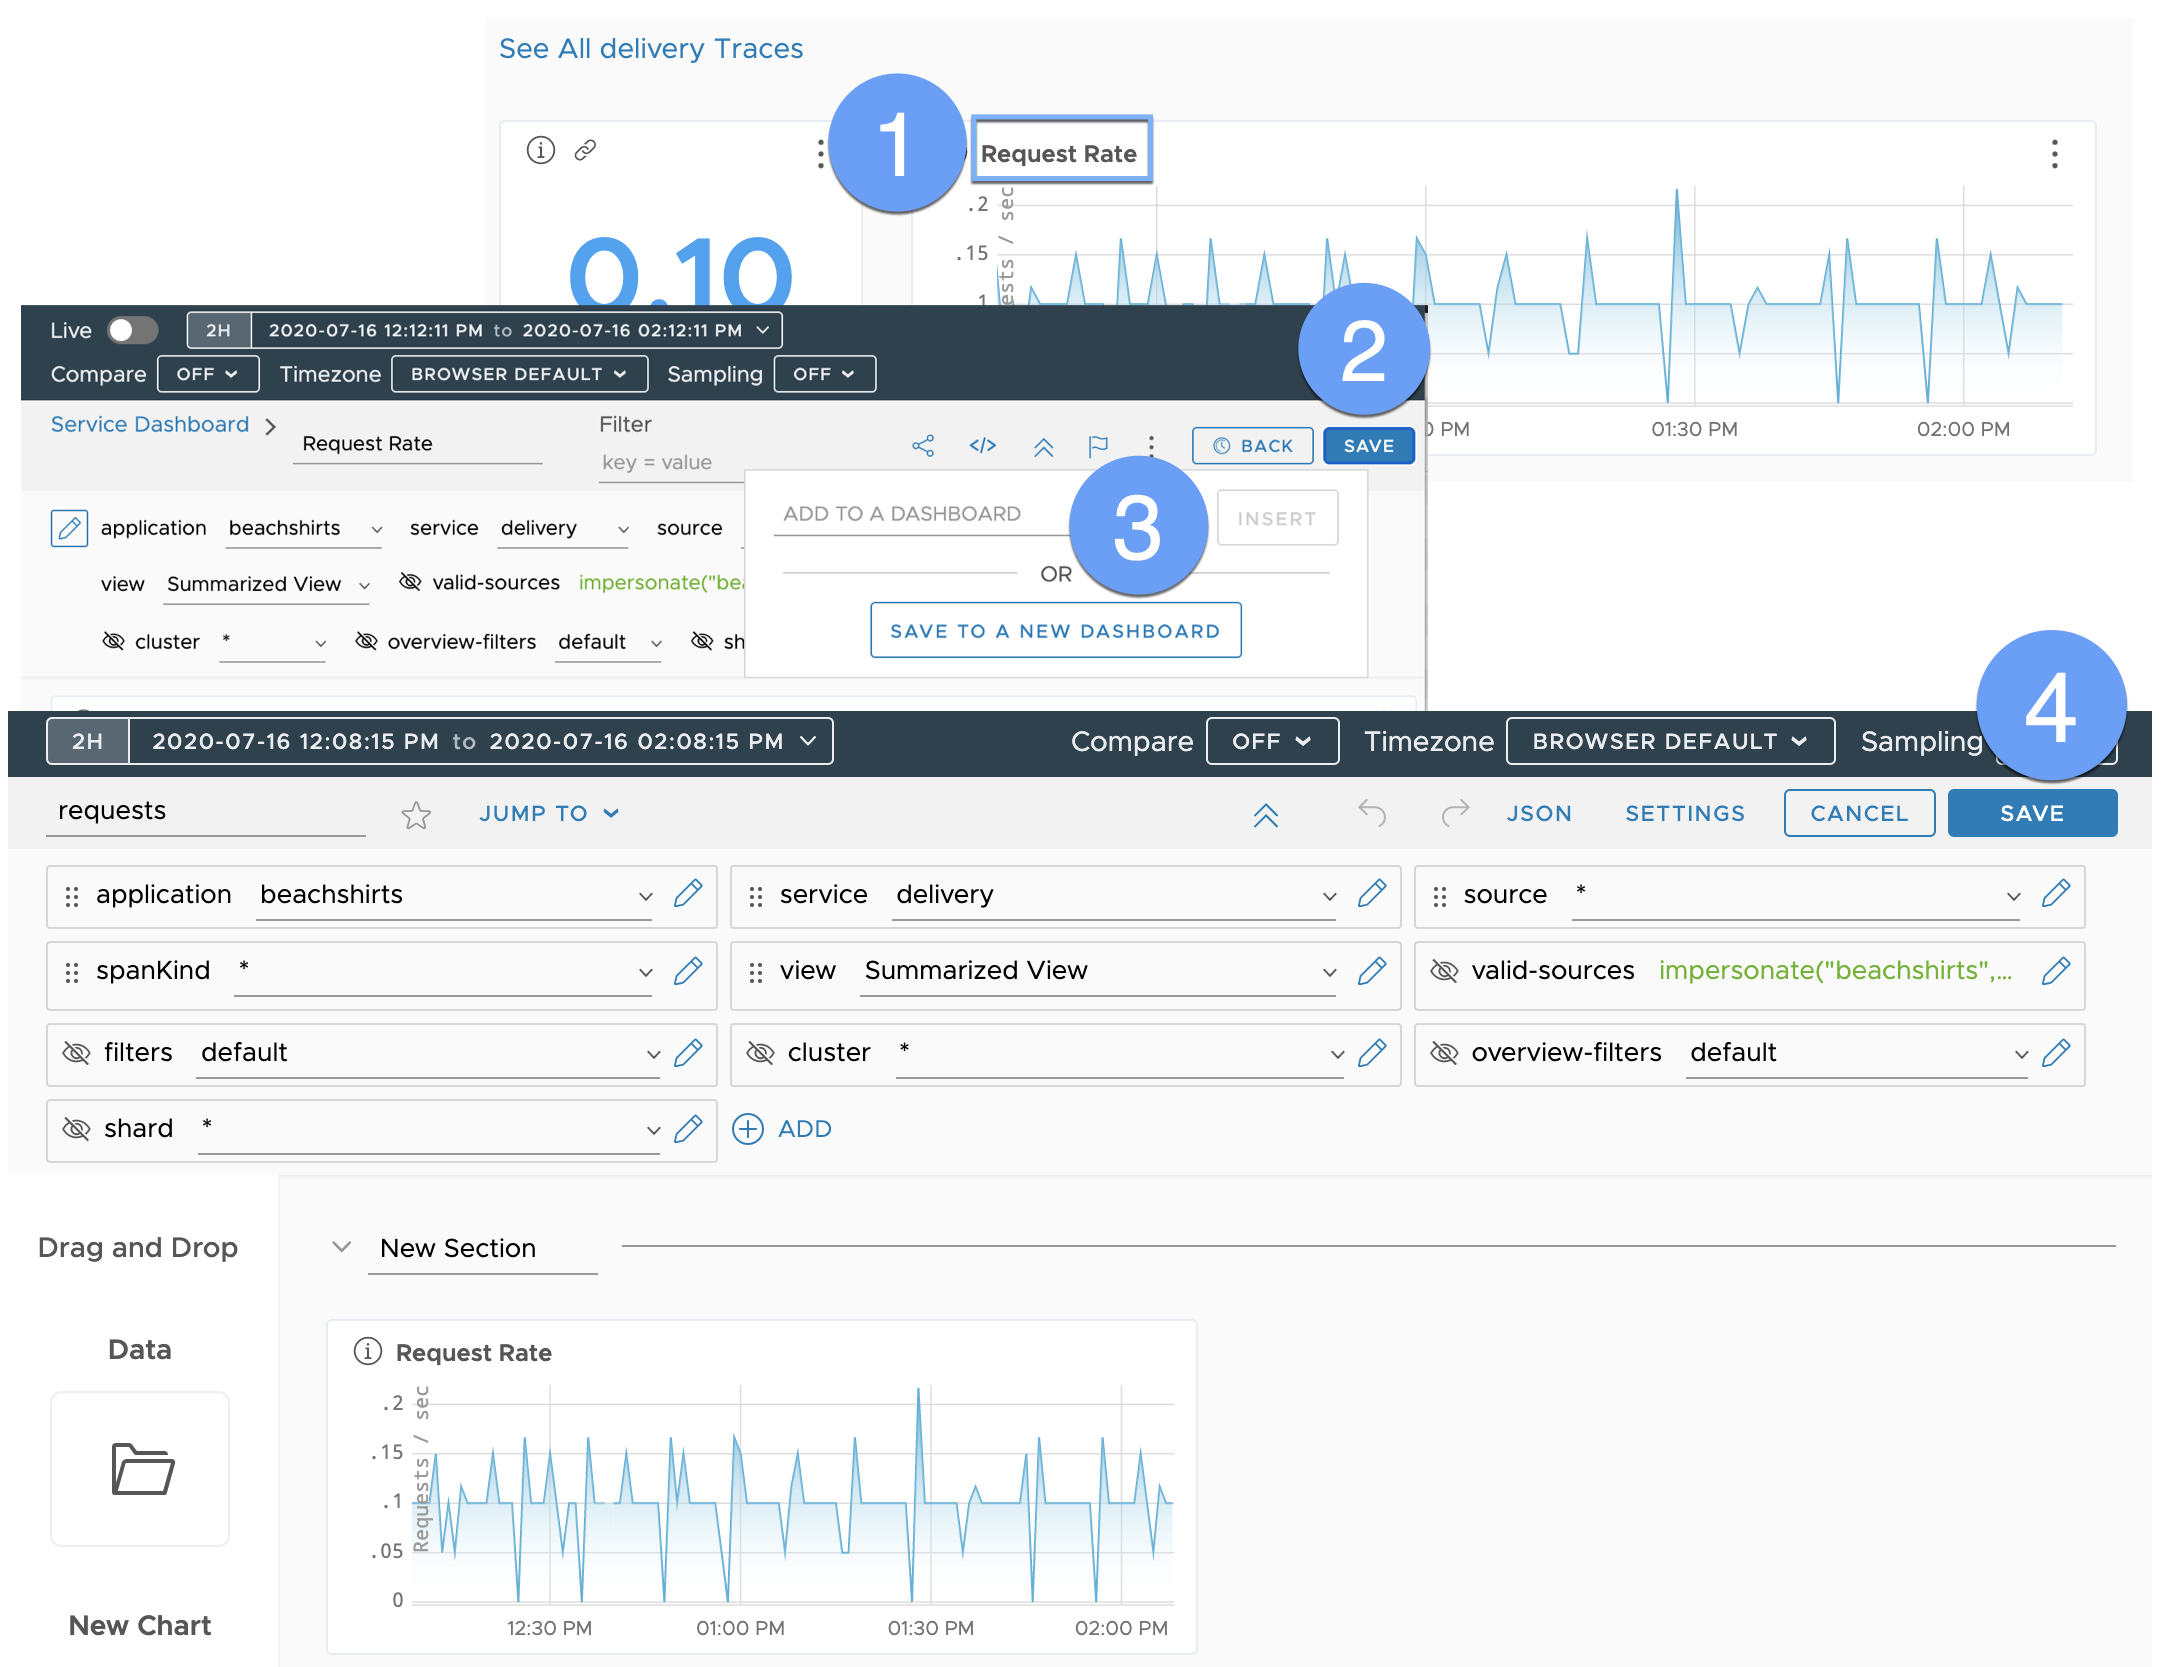
Save Charts in the Operation Dashboard
View queries used in the charts of the default Operation Dashboard and save these charts to your dashboard.
|
|