Come up to speed with tutorials in product, GitHub, and docs.
Learn about Tanzu Observability (formerly known as VMware Aria Operations for Applications) with in-product or external resources:
- Learn from the Product: Getting Started workflow, tutorial and tour integrations, help panel, integration setup examples.
- Tutorials, Videos, and More: Tutorials, Reference documentation, FAQs and Recipes, videos, and more.
Learn from the Product
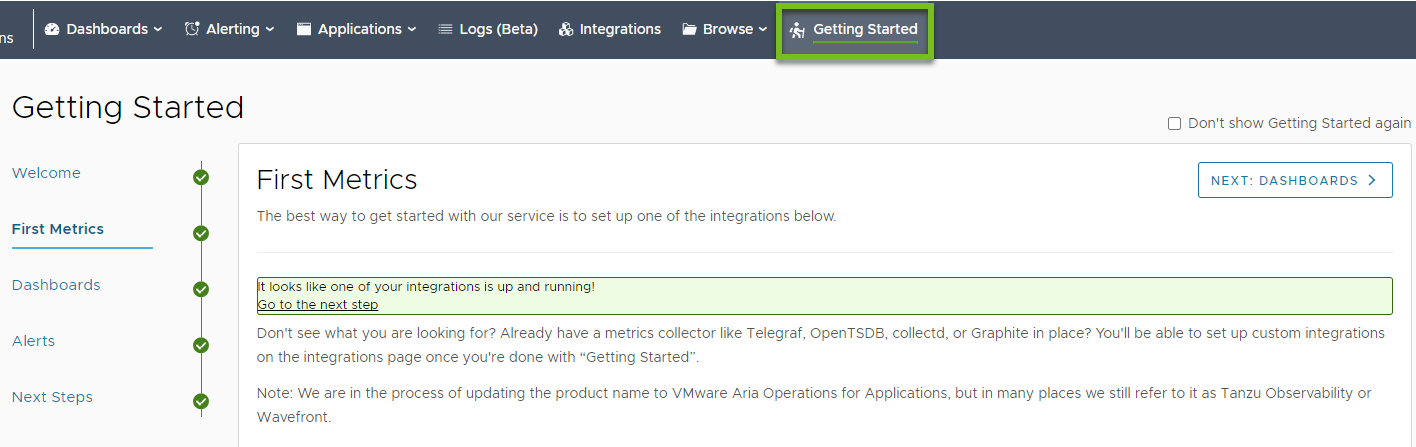
The Getting Started onboarding flow</stro ng> helps you get data in, build a dashboard, and create an alert.
- All trial users go through a Getting Started flow.
- All other users can click Getting Started on the toolbar to start.
You can use the customer-wide or user-level preferences to control whether Getting Started is visible on the toolbar.
</td>
 |
</tr>
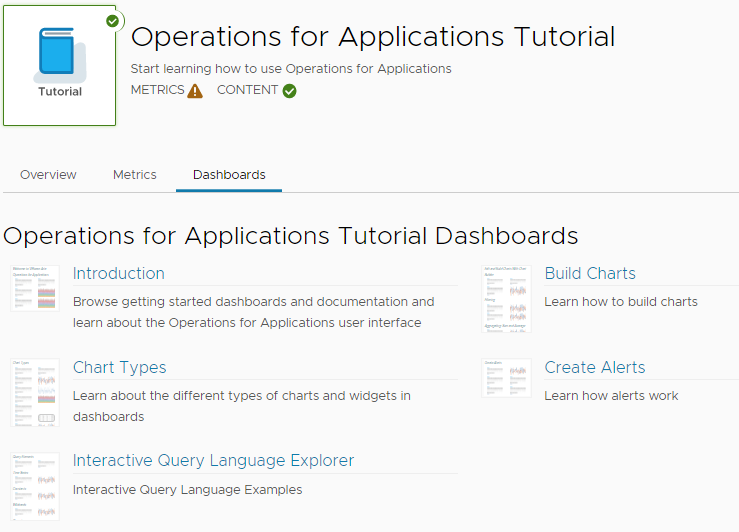
The Tanzu Observability Tutorial allows you to experiment with charts and alerts to learn (clone the integration to save your results).
- Click Integrations on the toolbar.
- Click the Tanzu Observability Tutorial tile and click the Dashboards tab.
- Click a dashboard and follow the instructions on the left to explore the charts (with sample data) on the right.
|
 |
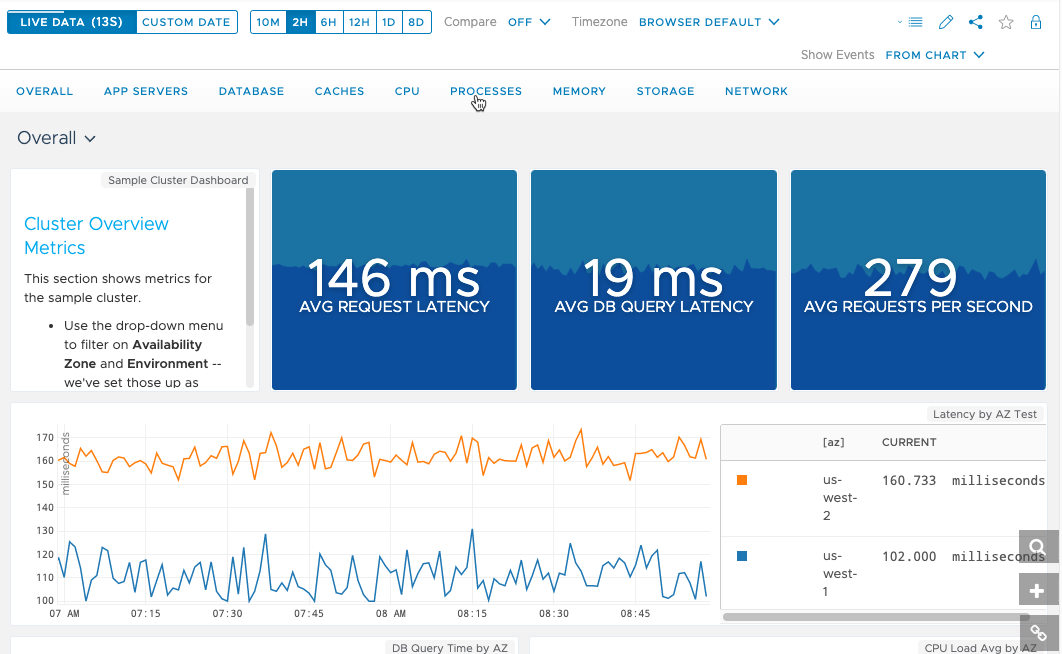
The Tanzu Observability Tour integration is a deep dive into the product functionality.
You can explore dashboards and charts, which use sample data to highlight functionalities such as Anomaly Detection or fine-tuning alerts. The tour also includes single-host and cluster metrics exploration dashboards.
- Click Integrations on the toolbar.
- Search for and click the Tanzu Observability Tour tile and click the Dashboards tab.
- Click any of the dashboards to explore data.
|
 |
|
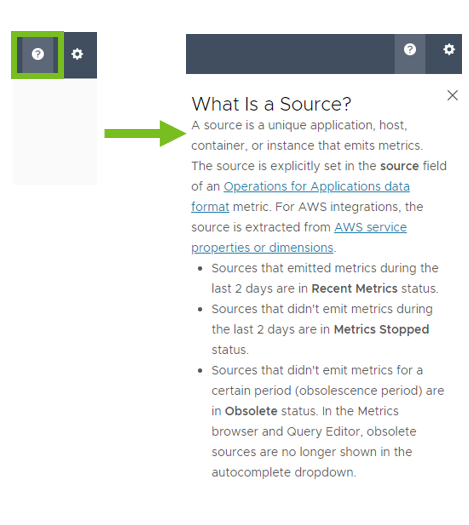
The Help panel is available for most screens when you click the question mark in the top right corner of the product. You'll get a brief overview and links to other information. |
 |
</tbody>
</table>
## Find Reference Documentation, FAQs, and Best Practices
Our documentation includes reference documentation for API, query language, and chart options. Our customer success team helped with FAQs and best practices.
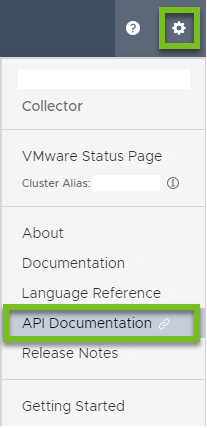
REST API reference documentation is available:
- From the gear icon in the top right of the toolbar inside the product (see screenshot). This option shows you the current version on your cluster.
- From the VMware Code website. This option shows the most recent version.
|
 |
| Query language reference documentation is available in this doc set. Click a link to see a function page with examples for that function, as shown in the screenshot on the right.
|
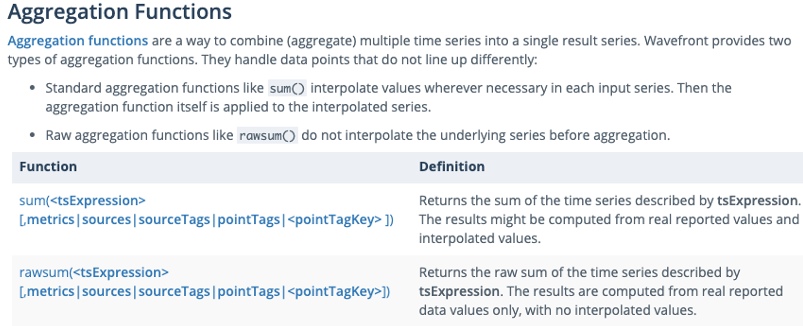 |
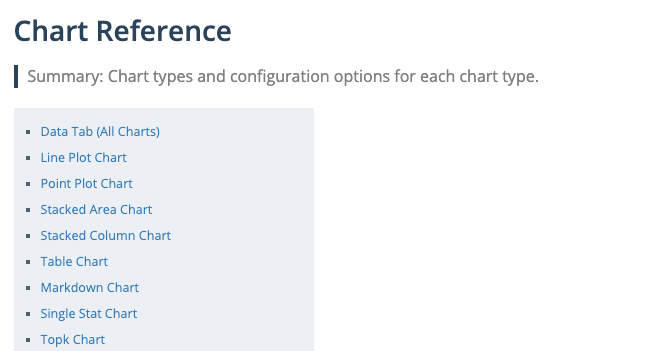
| The Chart Reference has details for each chart type. |
 |
| For Best Practices, our engineering and customer success teams continually update the information. Those doc pages have a label. Use the Best Practices tile in docs.wavefront.com or pick one of these popular Best Practices pages:
|
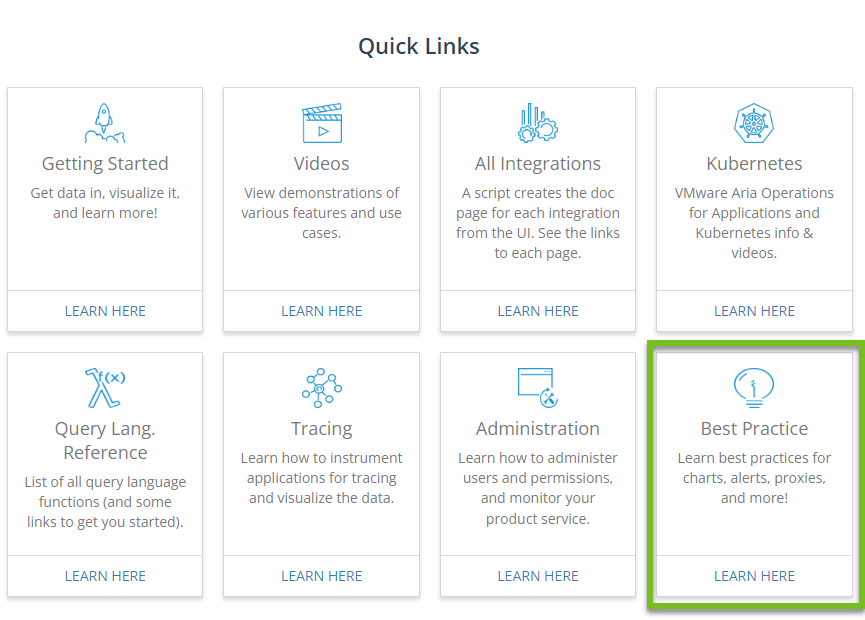 |
Our FAQ info helps both new and advanced users. We're updating this list as we hear from you in conversations or on Slack.
- Charts FAQ explains how to set color mapping, how to define drill down links, and more.
- Kubernetes FAQ addresses common questions, such as integrating with third-party applications.
- Tracing FAQ helps with common tasks like filtering RED metrics with custom span tags.
- Wavefront and Spring Boot FAQ explains differences between Freemium and trial clusters, how to visualize metrics and traces, and more.
|
 |
## Learn with Tutorials & Videos
This doc set includes a set of tutorials for common use cases and links to short videos that help you get up to speed quickly.
The [Tanzu Observability channel on VMware TV](https://vmwaretv.vmware.com/channel/Tanzu%2BObservability/252649793) offers 50+ videos including conceptual lightboard videos and many short how-to videos.
You can watch the Getting Started playlist videos on VMware TV or click below to start. or click below to start.
|