You can send data to VMware Tanzu Observability (formerly known as VMware Aria Operations for Applications) directly (by using direct ingestion) or by using the Wavefront proxy.
-
Direct data ingestion can be the best approach at the beginning only for testing purposes and during a POC. In production environments, the best way to send data is by using a Wavefront proxy.
Note: You must have the Direct Data Ingestion permission to perform direct data ingestion. -
In larger environments, send data to the Tanzu Observability service by taking advantage of proxy benefits:
Note: In production environments, you must send data to the Tanzu Observability service by installing a Wavefront proxy. Direct data ingestion is suitable only for test, trial, and POC environments and is not supported for production environments.- Prevent data loss, optimize network bandwidth – The proxy buffers and manages data traffic. Even if there’s a connectivity problem, you don’t lose data points.
- Simple firewall configuration – The proxy receives metrics from many agents on different hosts and forwards those metrics to the Tanzu Observability service. You don’t need to open internet access for each of the agents.
- Enrich or filter data – You can set up the proxy preprocessor to filter data before it’s sent to the Tanzu Observability service.
- Examine bottlenecks – Each proxy generates its own metrics. You can learn about incoming and outgoing data in the individual proxy dashboards and the Tanzu Observability Service and Proxy Data dashboard.
Background
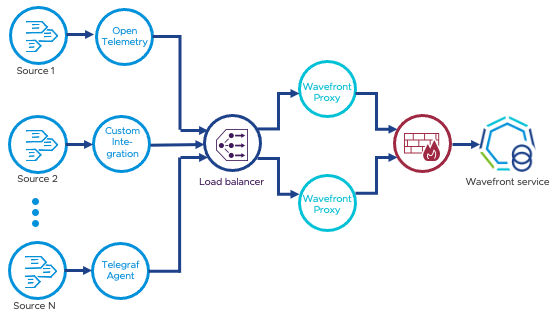
Most customers set up their environment so that the host, application, or custom code sends metrics to a Wavefront proxy installed in their environment. The proxy forwards metrics to the Tanzu Observability service. In production environments, two proxies behind a load balancer guarantee availability and prevent data loss.
Because some customers wanted to send data directly to the Tanzu Observability service, we made this functionality available.
Direct Ingestion Example Commands
The following examples illustrate how to send data directly to the Tanzu Observability service.
-
A token is required. Referred to as
<TOKEN>in the examples. Depends on your subscription type:- For VMware Cloud services subscriptions, a VMware Cloud services access token is required. You can retrieve an access token by exchanging your user API token or server to server OAuth credentials.
- For original subscriptions, an API token is required. The API token can be associated to a user account or service account.
- You must know your Tanzu Observability service instance name. This doc page uses
mydomain.wavefront.com. - Currently, direct ingestion supports only Tanzu Observability Data Format, which is named
wavefront. If you don’t specifyf=wavefront, we still use that format.
Multiple Data Points
Assume wavefront.txt contains 1 or more lines in the Tanzu Observability data format. You can send the data to the Tanzu Observability service like this:
cat wavefront.txt | curl -H "Authorization: Bearer <TOKEN>" -F file=@- https://mydomain.wavefront.com/report
Single Data Point
You can send a single data point like this:
echo "hello.world 1 source=<myhost>" | curl -H "Authorization: Bearer <TOKEN>" --data @- https://mydomain.wavefront.com/report
Histogram Distribution
You can perform direct ingestion of histogram distributions in histogram data format. You cannot perform direct ingestion of histogram data in Tanzu Observability data format.
Here’s a simple example:
echo '!M #20 30 #10 5 request.latency source=appServer1 region=us-west' | curl -H "Authorization: Bearer <TOKEN>" --data @- https://mydomain.wavefront.com/report?f=histogram
Notes:
- Enclose the distribution in single quotes for compatibility with the
!Msyntax. - Specify the distribution using the histogram data format.
- Include
f=histogramat the end of the--dataargument to ensure the input is treated as a histogram distribution.
Trace Data (Spans)
You can perform direct ingestion of trace data in Tanzu Observability span format.
Here’s a simple example:
echo "getAllUsers source=localhost traceId=7b3bf470-9456-11e8-9eb6-529269fb1459 spanId=0313bafe-9457-11e8-9eb6-529269fb1459 parent=2f64e538-9457-11e8-9eb6-529269fb1459 application=Wavefront service=istio cluster=none shard=none http.method=GET <start_milliseconds> <duration_milliseconds>" | curl -H "Authorization: Bearer <TOKEN>" --data @- https://mydomain.wavefront.com/report?f=trace
Notes:
- In the example, you:
- Specify the span using Tanzu Observability span format.
- Include
f=traceat the end of the--dataargument to ensure the input is treated as trace data. - Include
cluster=noneandshard=nonefor a span that does not have values for theclusterandshardspan tags. - Replace
<start_milliseconds>and<duration_milliseconds>with numbers indicating the span’s start time and duration.
- If you ingest spans using a direct ingestion command such the example above, you are limited to using Query Editor when you want to query for traces containing those spans. (Query Builder cannot find spans ingested in this way).
Proxy or Direct Ingestion?
Direct ingestion has some benefits, but also some limitations:
- No disk queueing
- No rate limiting
- No block list or allow list
- No preprocessor
- Only Tanzu Observability data format is currently supported. No support for OpenTSB, JSON, and Pickle
- No support for log ingestion
When you use direct ingestion, you might see 406 responses, which means that the Tanzu Observability service pushed back the data. Direct ingestion drops this data – and if you code your client to retry, you’re actually starting to rebuild the proxy.
It’s typical that the Tanzu Observability service doesn’t accept a small amount of data. This pushback doesn’t cause any issues with proxies. Consider this example:
- The data rate smoothed out over a minute is 100k PPS.
- The Tanzu Observability cluster is sized to 150k PPS (plenty of headroom).
- However, the client (customer) sends all the data for each minute on the minute. The client might send 6M PPS in 1 second, then nothing for 59 seconds, then repeat.
Tanzu Observability doesn’t size your cluster for 6M PPS when the smoothed-out traffic is really 100k PPS. Instead, the Tanzu Observability service relies on the proxy to smooth out the traffic over the minute. Proxies retry queued points, so even with just one proxy you won’t see dropped points.
With direct ingestion you might lose data. In most cases, using a proxy will therefore give you more reliable results.