In VMware Tanzu Observability (formerly known as VMware Aria Operations for Applications), a source is a unique application, host, container, or instance that emits metrics. The source is explicitly set in the source field of an Tanzu Observability data format metric. For AWS integrations, the source is extracted from the AWS CloudWatch service properties or dimensions.
- To view and manage sources, click Browse > Sources on the toolbar.
- To filter and group in charts, use the Wavefront Query Language. You can filter by source and filter and group by source tags.
Examine Sources in the Source Browser
If you don’t see metrics in charts that filter by source, you can examine sources in the Sources browser.
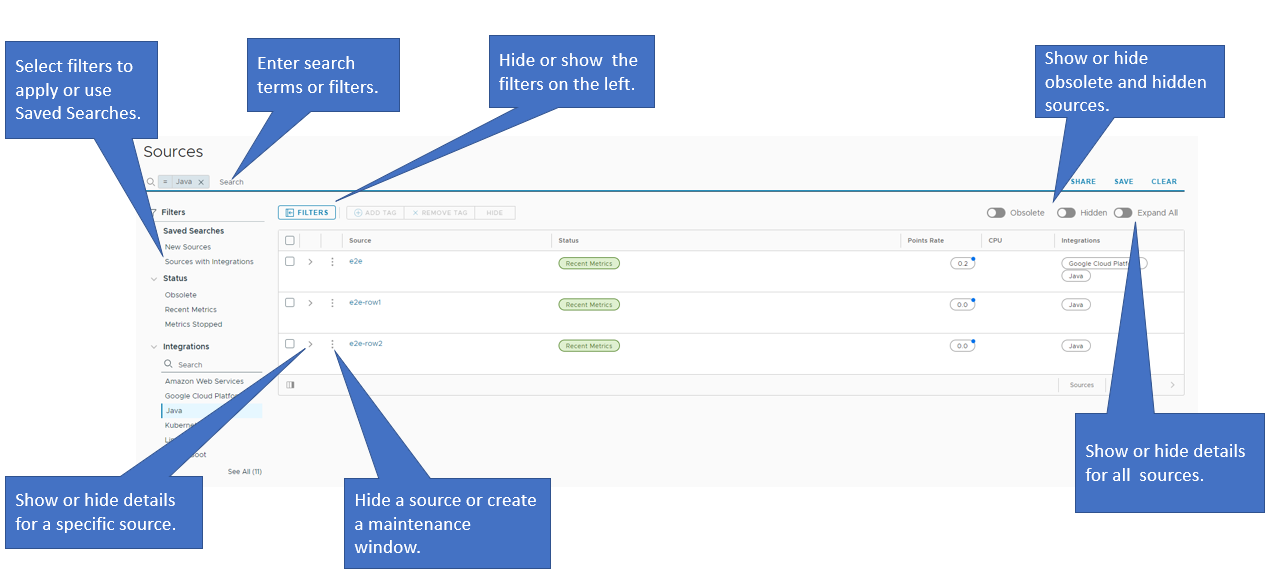
On the Sources browser, you can:
- Search for sources and apply filters to the sources so that you can narrow down the results.
- Share, save, and clear search results.
- Browse through a list of saved searches.
- Hide or show the filters and the saved searches list displayed on the left by clicking the Filters button.
- Show the details for all sources by turning on the Expand All toggle. By default, this setting is turned off.
- Show the details for a specific source by clicking the arrow next to the check box of the source.
- Hide a single source or create a maintenance window for the alerts with a particular source by clicking the ellipsis icon and selecting the respective option from the menu.
- Select the check boxes of multiple sources and delete them by clicking the Delete button.
- Add or remove source tags.
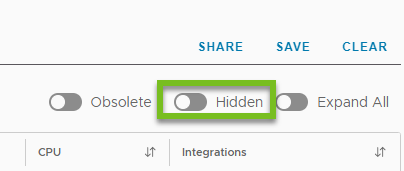
- Show or hide obsolete and hidden sources.
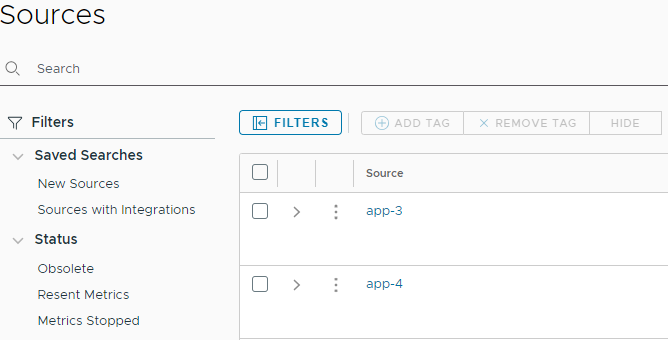
Step 1: Find a Source
When you select Browse > Sources the Sources browser offers many options to zoom in on the sources you’re interested in.
Filter sources by status.
|
 |
|
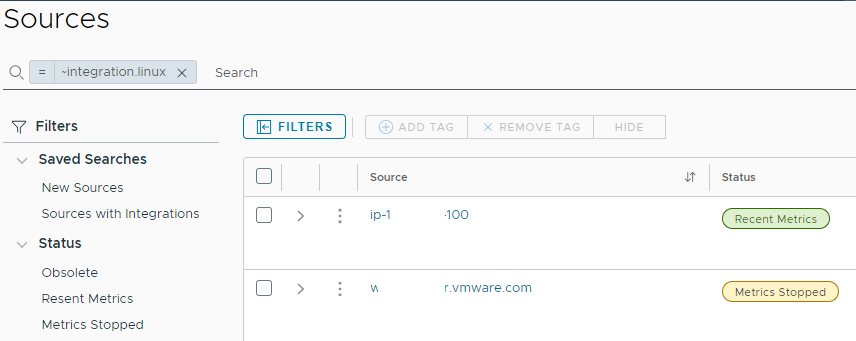
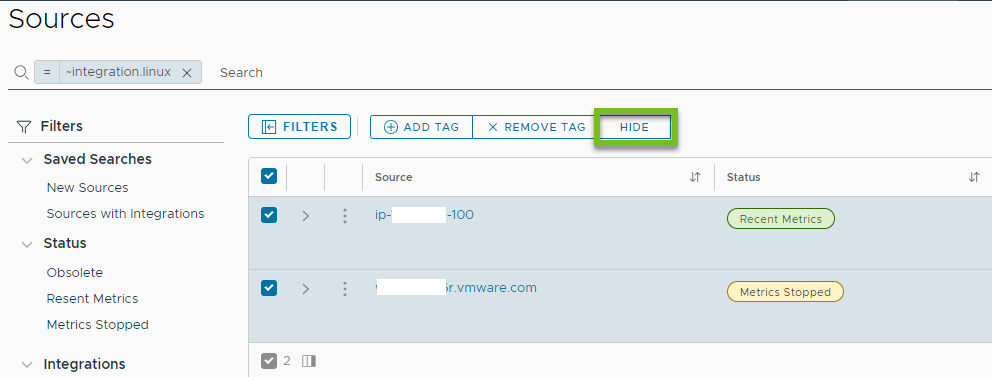
Filter sources by tag. In most environments, administrators add source tags. You can add source tags from the UI or programmatically. In the screenshot on the right, we've filtered by the tag `integration.linux`. |
 |
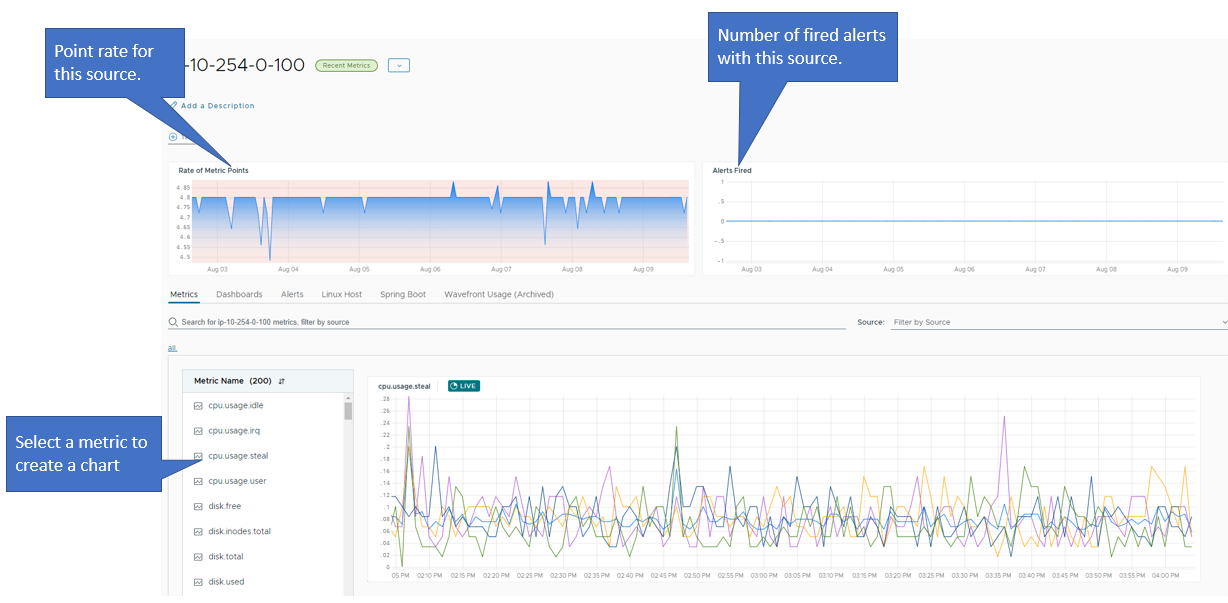
Step 2: Examine the Source
When you select a source in the Sources browser, you can examine it in more detail on a second page.
Hide and Show Sources
With more and more companies using dynamic services such as AWS, it’s typical to have sources constantly being spun up and shut down.
- In the Sources browser, all sources are included unless you explicitly exclude Obsolete sources.
- In the Metrics browser and Query Editor, obsolete sources are no longer shown in the autocomplete drop-down menu. You can also manually hide sources by using the UI or API.
ts() queries when data values are present.
To hide one or more sources:
|
 |
To view hidden sources
|
 |
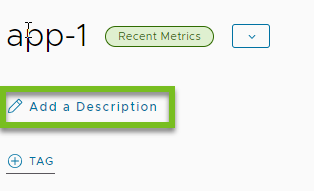
Add and Edit Source Descriptions
Source descriptions are a great way to add details, such as the role, availability zone, or running applications, to a source.
To add or edit a source description:
|
 |