In addition to the dashboard for monitoring your overall usage of Tanzu Observability (formerly known as VMware Aria Operations for Applications), you can use ingestion policies for monitoring usage by specific accounts, groups, sources, metric namespaces, or point tags. For example, it might be valuable to understand the ingestion rates of the different teams in your organization or by the different sources and manage their consumption, cost, overage, etc.
By creating an ingestion policy, you combine a set of accounts, groups, sources, metric namespaces, or point tags. Optionally, you can set a Points per Second (PPS) limit for the ingestion policy and associate it with an alert. After you create an ingestion policy, you can start monitoring the ingestion policy dashboard, which shows:
- The P95 PPS usage per billing period since the creation of the policy.
- The PPS limit with the associated alert, if configured.
- The percentage change in the PPS usage per billing period.
- The hourly PPS usage.
- The accounts that ingest most data.
- The ingestion by ingestion type (proxy and direct ingestions).
- The ingestion by data type (time series, histograms, and delta counters).
For performance monitoring of your Tanzu Observability instance, you can use wftop and spy, the Slow Query dashboard, and the Usage integration.
Ingestion Policy Basics
Ingestion policies allow you to combine user and service accounts, groups, sources, metric namespaces, or point tags, so that you can monitor their usage of the Tanzu Observability service. For example, you can create a policy for a group of new hires. You can also create a policy for one or more source virtual machines. Also, you can set a Points per Second (PPS) limit for the policy and create an alert, so that you can receive notifications if the PPS usage exceeds certain thresholds of the limit.
Tracking the PPS usage by ingestion policy can help you understand how the overall usage is distributed and whether a particular team will need more PPS in the future or will need to reduce their overhead ingestions.
The policy scope can be accounts, groups, sources, namespaces, or point tags.
- Once you set the scope, you cannot change it.
- You can change the accounts or objects assigned to the policy only from the selected scope.
- A given account or object can belong to more than one policy.
Create an Ingestion Policy
Step 0: Start the Ingestion Policy Creation
- Log in to your service instance as a user with the Ingestion Policies permission.
- From the gear icon on the toolbar, select Ingestion Policies.
- Click New Ingestion Policy.
Step 1: Specify the Scope and PPS Limit
In the Data panel, specify the scope and, optionally, a PPS limit and click Next.
-
Select the Scope of the policy and enter the objects from that scope that you want to assign to the policy.
Scope Description Accounts Depends on your subscription type. - If your Tanzu Observability service is onboarded to VMware Cloud services, individual users, server to server apps, and service accounts.
- If your Tanzu Observability service is an original subscription, individual user and service accounts.
Groups Depends on your subscription type. - If your Tanzu Observability service is onboarded to VMware Cloud services, groups of VMware Cloud services users.
You can also select the Everyone internal system group (which includes all users) or the Service Accounts internal system group (which includes all server to server apps that have access to your service as well as all service accounts in your service).
- If your Tanzu Observability service is an original subscription, groups of user and service accounts, including the Everyone and Service Accounts system groups.
Sources Sources that emit metrics. You can assign exact source names and names with wildcards, for example, appServer1andappServer*.Namespaces Namespaces that group metrics in a hierarchy defined by a name prefix. You can assign exact metric names and namespaces, for example, request.andrequests. You can also assign names with wildcards, for example,cpuloadavg*andcpu.*.Point Tags Point tags that are optional key-value pairs associated with a metric. You must assign exact tag keys with exact tag values or wildcards, for example, env="dev"orenv="*".If you assign a combination of point tags, you must select the match criterion - can be either Has tags (logical OR) or Has all these tags (logical AND).
Note: After you create the policy, you cannot change the scope. You can change only the assigned accounts or objects from that scope. -
Choose whether you want to set a PPS limit for the policy. If you select Set PPS Limit, you must enter the PPS limit number in the PPS per billing period text box.
The limit becomes visible in the ingestion policy dashboard charts. If you set a PPS limit, you must create the ingestion policy alert in the next steps.
Step 2: Configure the Ingestion Policy Alert
If you set a PPS limit for the ingestion policy, Tanzu Observability creates an ingestion policy alert that queries the PPS usage by the policy as a percentage of the PPS limit.
- In the Conditions panel, configure the thresholds and severities.
- Select the comparison operator for the alert condition. In most cases, you alert when the usage is greater than a specified threshold percentage of the PPS limit.
-
For at least one severity, specify a threshold percentage of the PPS limit and click Next.
The threshold percentage becomes visible in the ingestion policy alert chart.
You can skip the other settings in the Conditions panel.
- Optionally, in the Recipients panel, specify who will receive the alert notifications and click Next.
- In the Alert Name and Tags panel, enter a name for the alert and, optionally, tags and click Next.
After you create the ingestion policy, you can view the associated alert on the corresponding ingestion policy dashboard and on the Alerts Browser page.
Step 3: Name and Activate the Ingestion Policy
In the Create panel, enter a name for the policy and, optionally, a description and click Create.
Edit an Ingestion Policy
After you create an ingestion policy, if you need, for example, to increase the PPS limit, or assign more accounts or point tags, you can edit the policy.
- Log in to your service instance as a user with the Ingestion Policies permission.
- From the gear icon on the toolbar, select Ingestion Policies.
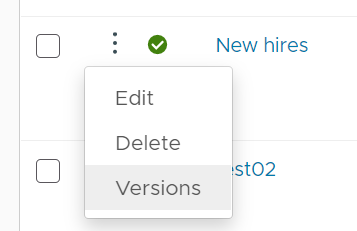
- Click the ellipsis icon next to the policy that you want to edit and select Edit.
- Enter the necessary changes and click Save.
View Ingestion Policy History and Revert to a Previous Version
Every time a user with the Ingestion Policies permission edits an ingestion policy, they create a new version of that policy. All users can see the details of each version of the policy. Users with the Ingestion Policies permission can also revert the policy to an exact copy or to an edited copy of an earlier version. Reverting a policy to an earlier version creates a new version of that policy.
To access the version history of an ingestion policy:
|
 |
The Earlier Versions page shows the details of each version of the policy.
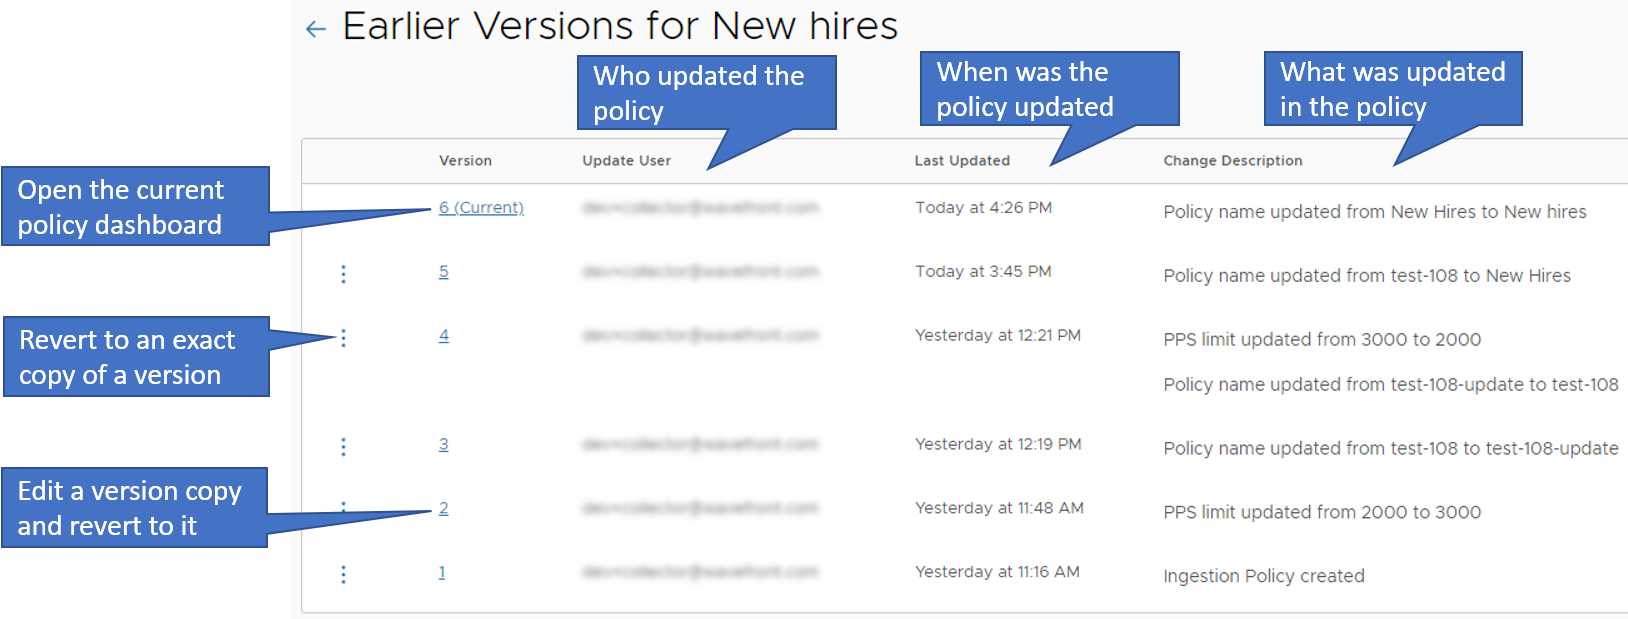
On this page, you can:
- Open the current policy dashboard by clicking the current version number.
- See the user who updated the policy and created a specific version, when was the policy updated, and what was updated in the policy.
If you have the Ingestion Policies permission, you can also:
- Revert the policy to an exact copy of an earlier version, that is, create a new version that is an exact copy of the selected version.
- Edit a copy of an earlier version and revert the policy to it, that is, create a new version that is an edited copy of the selected version.
Delete an Ingestion Policy
If you no longer need an ingestion policy, for example, after a reorganization in your company, you might want to delete an ingestion policy.
- Log in to your service instance as a user with the Ingestion Policies permission.
- From the gear icon on the toolbar, select Ingestion Policies.
- Click the ellipsis icon next to the policy that you want to delete, select Delete, and confirm.
Examine the Service Usage by Ingestion Policy
All users can view the ingestion policies and examine the ingestion policy dashboards to understand their PPS usage over time.
- Log in to your service instance.
-
From the gear icon on the toolbar, select Ingestion Policies.
The Ingestion Policies page shows all existing ingesting policies.
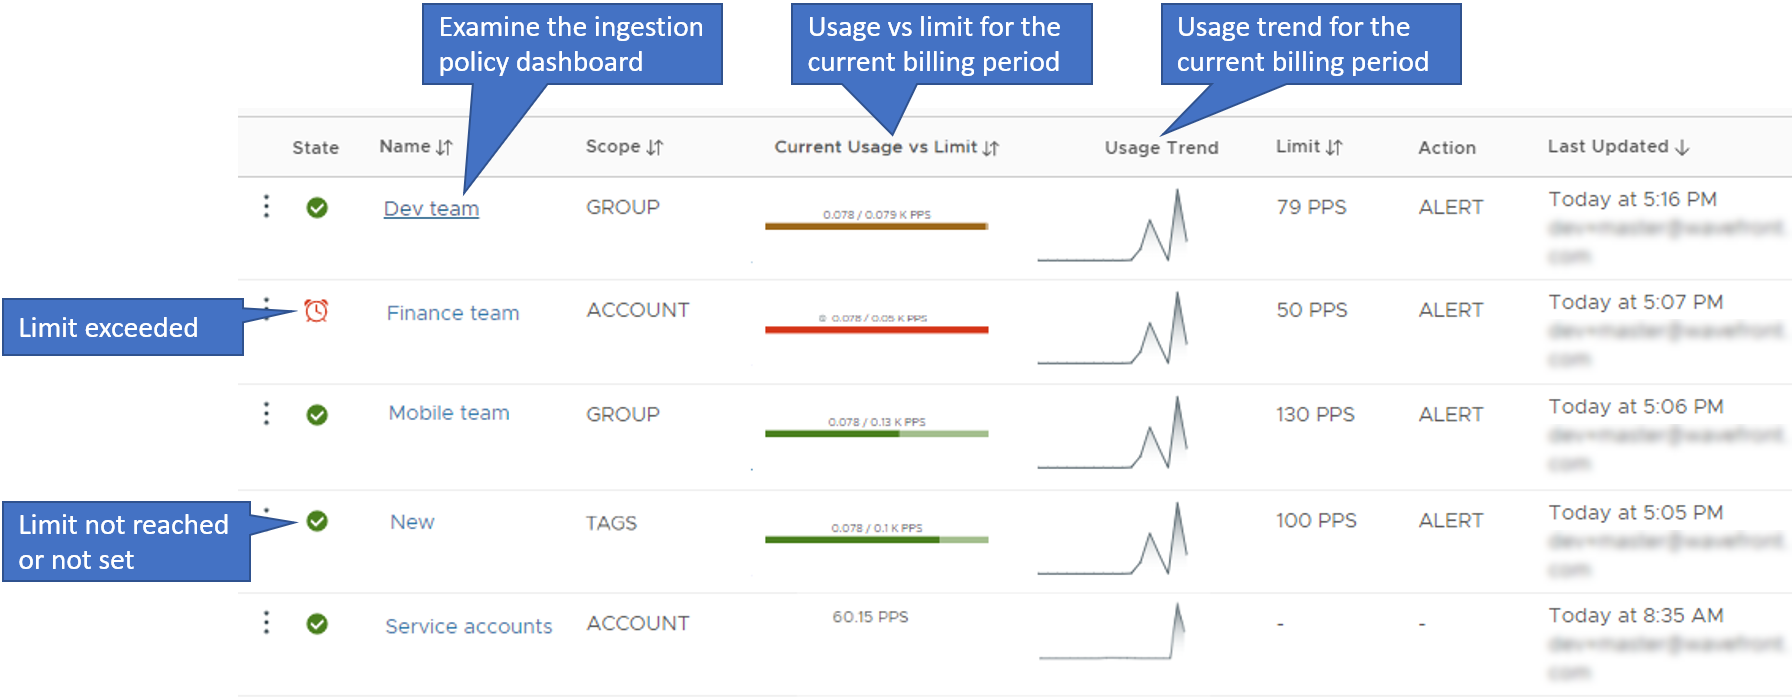
For each policy you can see:
- The state of the policy, i.e. whether the limit is exceeded, or the limit is not reached or not set.
- The name of the policy. If you click the name, you can examine the respective ingestion policy dashboard.
- The current usage vs limit for the current billing period.
- The usage trend for the current billing period.
- The PPS limit, if set.
- Whether the ingestion policy has an alert associated with it.
- Date, time, and account of the last update.
-
Click the name of the policy in which you are interested and examine the policy dashboard.
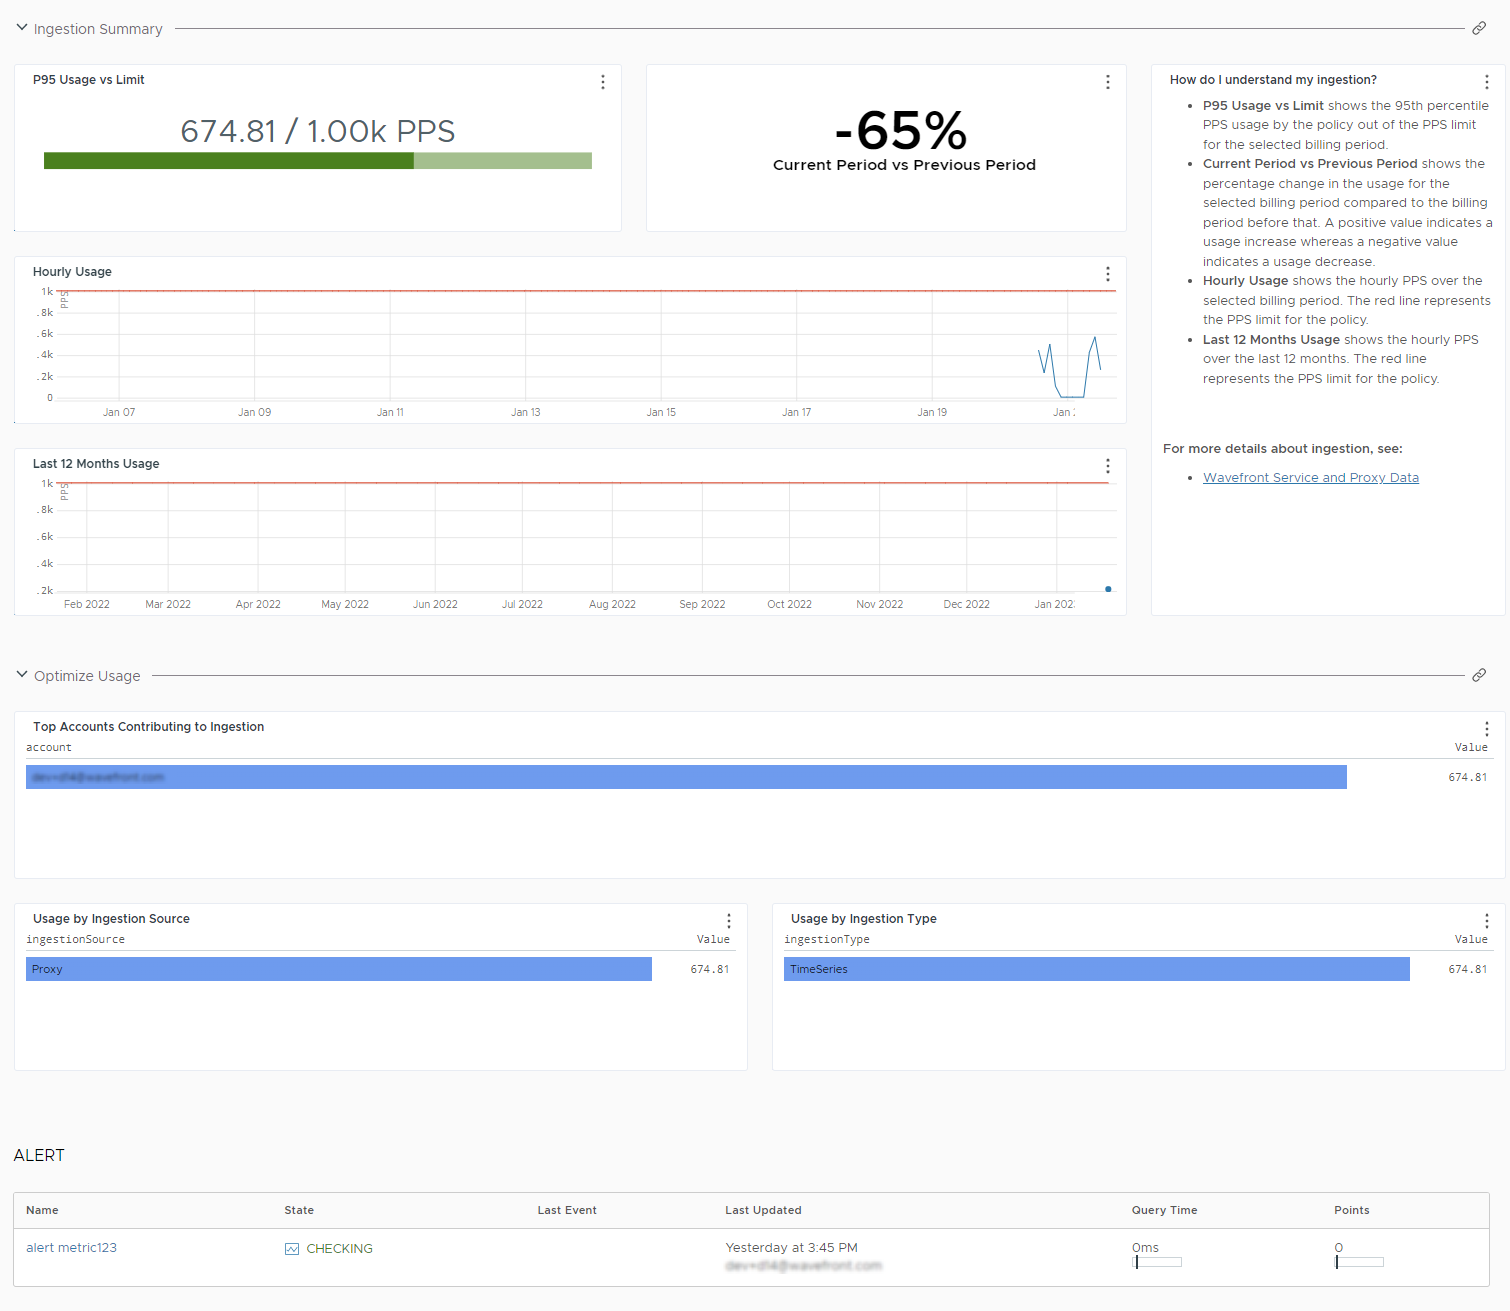
The ingestion policy dashboard contains the Ingestion Summary and Optimize Usage sections. If the ingestion policy has a PPS limit, the dashboard also includes the Alert section.
-
In the Ingestion Summary section of the dashboard, you can see the following list of charts:
Chart Description P95 Usage vs Limit Shows the 95th percentile PPS usage by the policy out of the PPS limit for the selected billing period. Current Period vs Previous Period Shows the percentage change in the usage for the selected billing period compared to the billing period before that. A positive value indicates a usage increase whereas a negative value indicates a usage decrease. Hourly Usage Shows the hourly PPS usage over the selected billing period. The red line represents the PPS limit for the policy. Last 12 Months Usage Shows the hourly PPS usage over the last 12 months. The red line represents the PPS limit for the policy. -
In the Optimize Usage section of the dashboard, you can see a list of charts that lets you investigate usage further by accounts, ingestion mechanisms, and data types.
Chart Description Top Accounts Contributing to Ingestion Shows which accounts contribute the most. Usage by Ingestion Source Shows the usage by ingestion mechanism - proxy and direct ingestions. Usage by Ingestion Type Shows the usage by data type - time series, histograms, and delta counters. -
If the ingestion policy has a PPS limit, the dashboard also includes the Alert section that provides details about the associated alert.
-
In addition, the Tanzu Observability Usage integration includes the Tanzu Observability Ingestion Policy Explorer Dashboard, which provides a granular breakdown of the ingestion across your organization by ingestion policies, accounts, sources, and types.
Example: Monitor Which Teams Are Responsible for How Much Ingested Data
Consider the following example. You are administering a Tanzu Observability service instance for two big teams, IT Team1 and IT Team2, and you want to monitor how much data each of the team uses. IT Team1 usually needs more PPS data, and you have only 10,000 of committed PPS on a monthly basis.
You can create an ingestion policy for each team to monitor how much data each team uses per month. You can also set a PPS limit for each ingestion policy and if a team consumes more than expected, you will receive an alert notification, so that you can provide additional training on how to use ingested data wisely.
Learn More!
Improve PPS and Prevent Overage explains how to use tools and dashboards to learn how much data is coming in, who is sending the data, how to get alerted if ingested data get close to monthly contracted usage, and how to optimize your ingestion rate.