VMware Tanzu Observability (formerly known as VMware Aria Operations for Applications) includes metadata (label manipulation) functions that enable users to temporarily rename a source, rename a metric or create a synthetic point tag. Dashboards and charts display the changed name or aggregated point tag. We support:
aliasSource- Manipulate a source namealiasMetric- Manipulate a metric nametaggify- Manipulate a point tag name
This page uses vSphere and ~sample metrics to demonstrate how you can change a table column heading and the text in the column. Screenshots illustrate the changed labels, for example, you might see a metric like vsphere.host.cpu.used.summation. The same principles apply for other data and other chart types.
Overview
All three metadata functions support these options:
| Option | Example |
|---|---|
| Specify a string to add to or replace a string in the source. | Change “esxi-11” to “esxi-11-to-be-decommissioned” |
| Use a numeric zeroBasedNodeIndex to change a string at a specific location in the source string. | Rename a source from "version.7.esxi101" to "esxi101".
|
| Use a regex search and replace pattern. |
|
Parameters
The functions have the following parameters.
aliasSource(<tsExpression>, [metric|source|{tagk,<pointTagKey>},]zeroBasedNodeIndex[, "delimiterDefinition"] |"regexSearchPattern", "replacementPattern" |"replacementString")

aliasMetric(<tsExpression>, [metric|source|{tagk,<pointTagKey>},]zeroBasedNodeIndex[, "delimiterDefinition"] |"regexSearchPattern", "replacementPattern" |"replacementString")

taggify(<tsExpression>, metric|source|{tagk,<pointTagKey>}, <newPointTagKey>, zeroBasedNodeIndex[, "delimiterDefinition"] | "regexSearchPattern", "replacementPattern" | "replacementString")
String Replacement Examples
Learn how to change the displayed source name, metric name, or point tag.
aliasSource String Replacement
To change the displayed source name to a different name use this syntax:
aliasSource(<tsExpression>, "replacementString")
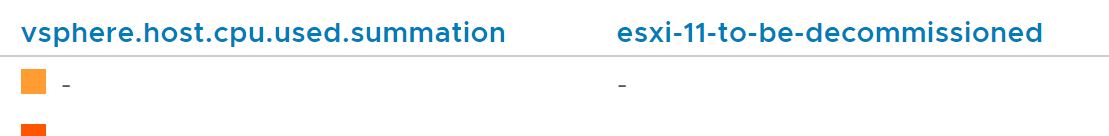
For example, to rename a source from esxi-11 to esxi-11-to-be-decommissioned use:
aliasSource(ts("vsphere.host.cpu.used.summation", source="esxi-11"),"esxi-11-to-be-decommissioned")
aliasMetric String Replacement
To change the displayed metric name to a different name, use this syntax:
aliasMetric(<tsExpression>, "replacementString")
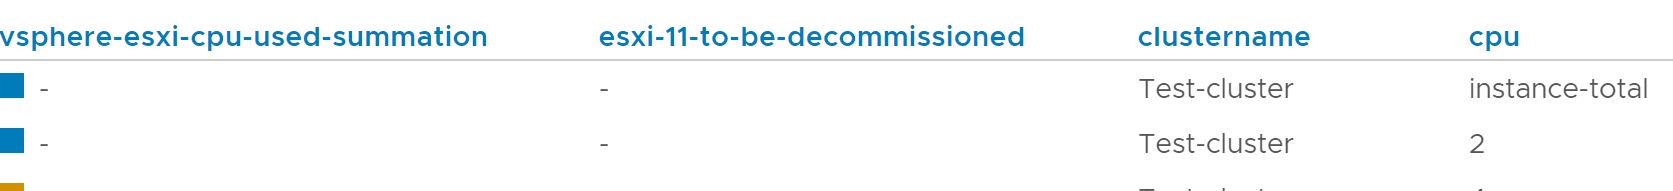
For example, to rename a metric from vsphere.host.cpu.used.summation to vsphere-esxi-cpu-used-summation use this:
aliasMetric(ts("vsphere.host.cpu.used.summation"),"vsphere-esxi-cpu-used-summation")
taggify String Replacement
To add a displayed point tag using taggify, use this syntax:
taggify(<expression>, <newPointTagKey>, "<newPointTagValue>")
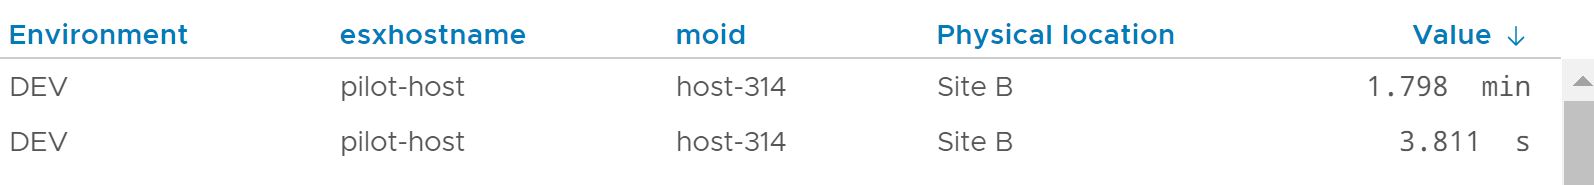
For example, to add a point tag Physical location, Site B use:
taggify(ts("vsphere.host.cpu.used.summation" and source="esxi-11"), "Physical location", "Site B")
String Replacement with Variables Examples
You can specify a variable that generates a string from the time series. Then you can replace all or part of an existing source name, metric name, or point tag with that variable.
aliasSource and Variables
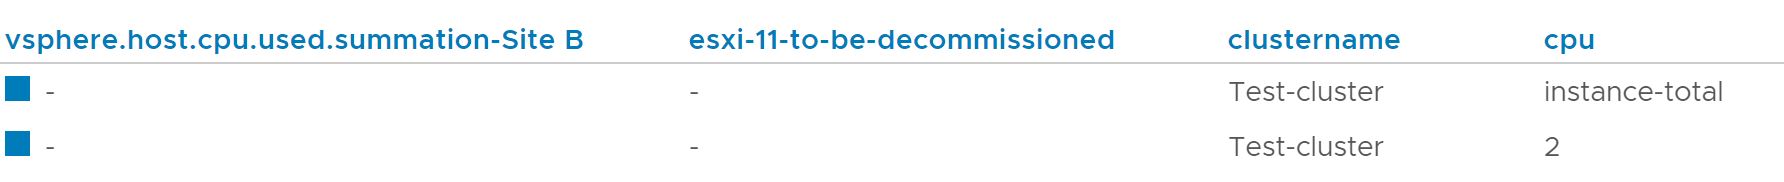
The following example uses aliasSource() to alter the source to include the value of the specified point tag for physical location. Here a variable ${A} is set to taggify("vsphere.host.cpu.used.summation" and source="esxi-11", "Physical location", "Site B").
The table column header becomes esxi-11-to-be-decomissioned-site-B with this query:

aliasMetric and Variables
The following example uses aliasMetric() to change the metric name to the value of the specified point tag for physical location. Here a variable ${A} is set to taggify("vsphere.host.cpu.used.summation" and source="esxi-11", "Physical location", "Site B").
The table column header includes the physical location with this query:
taggify and Variables
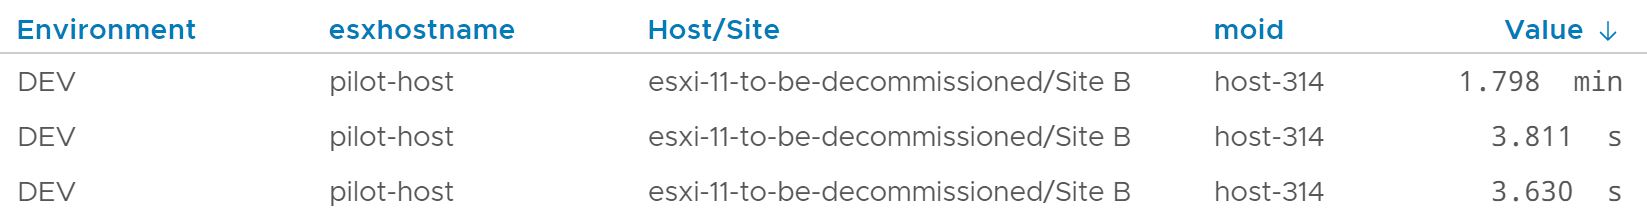
The following example uses taggify() to add a new point tag. The example uses an existing point tag in combination with the source, for source and physical location. The variable is set to taggify("vsphere.host.cpu.used.summation" and source="esxi-11", "Physical location", "Site B")).
The table column header shows Host/Site and the column itself combines the source with the physical location.
Examples that Use zeroBasedNodeIndex
When using any of the metadata functions, you can extract a single element (node) from an existing source name, metric name, or point tag value and use the element as a new value.
Nodes are indexed from left to right, starting with 0. A delimiter (“.”) separates the nodes. For example, in the sample metric vsphere.host.cpu.used.summation we have these nodes:
- Node 0:
vsphere - Node 1:
host - Node 2:
cpu - Node 3:
used - Node 4:
summation
Source Name Replacement with zeroBasedNodeIndex
To change the displayed source name to a different name, use zeroBasedNodeIndex in this syntax of aliasSource:
aliasSource(<tsExpression>, [metric|source|{tagk, <pointTagKey>},] <zeroBasedNodeIndex> [, "<delimiterDefinition>"])
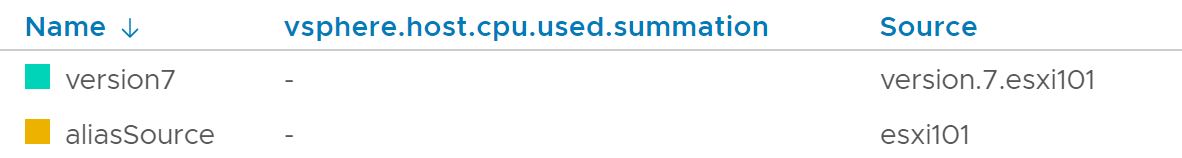
For example, you can rename a source from version.7.esxi101 to esxi101.
aliasSource(ts("vsphere.host.cpu.used.summation", source="version.7.esxi101"), 2)
Here:
- The delimiter is a period.
- We use the index 2 to use the 3rd node from the left.
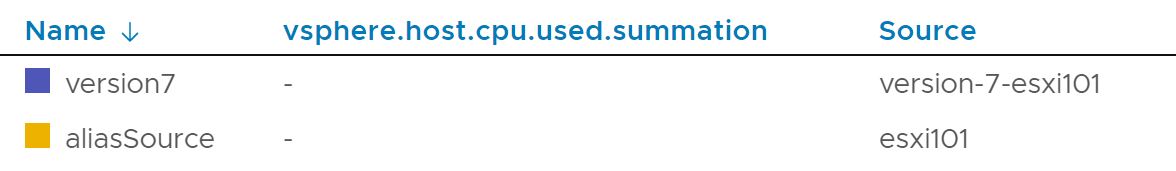
If the delimiter is not a period, you can include the delimiter definition in the query. For example, if the source uses hyphens (version-7-esxi101), use the following query to rename the source:
aliasSource(ts("vsphere.host.cpu.used.summation", source="version-7-esxi101"), 2,"-")
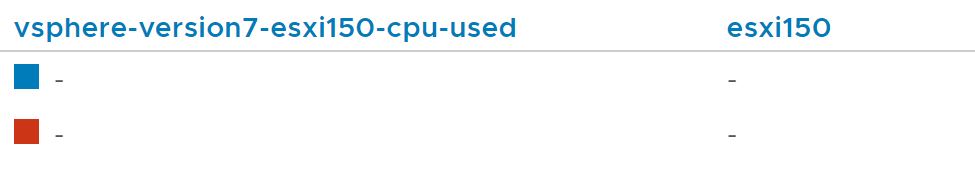
You can use elements of the metric name to rename the source. For example, if the metric name is vsphere-version7-esxi150-cpu-used and you want to rename the source to the third element in the metric name esxi150, use this query:
aliasSource("vsphere-version7-esxi150-cpu-used"),metric, 2,"-")
Source Name Replacement with Point Tag Elements
You can use elements of a point tag to rename the source name from a point tag specify the point tag with tagK and the point tag name. For example
- The point tag
hostnamehas a valueesxi1750.vmware.com - You want to rename the source to
esxi1750using zeroBasedNodeIndex. Use this query (where node 0 is esxi1750):aliasSource(ts("vsphere.host.cpu.used.summation",tagK,hostname,0)
If the query references a node that doesn’t exist, an error results. For example, assume the following query:
aliasSource(ts("vsphere.host.cpu.used.summation",tagK,hostname,5)
Because the source only has 5 element and index 5 goes to element 6, the following error message results:
globalFilter() removed all query keys
Cannot access node: 5 from source value: vsphere.host.cpu.used.summation
Regex Search and Replace Pattern Examples
Regex patterns in aliasSource, aliasMetric, and taggify work perform a search and replace. If there is no match during the search, there is nothing to replace, so the original displayed values remain.
Replace Source Name with aliasSource() and Regex
You can change the source name displayed in charts to a different name using a search and replace regex. Use this syntax:
aliasSource(<tsExpression>, [metric|source|{tagk,<pointTagKey>},"regexSearchPattern", "replacementPattern" )
For example, assume you want to:
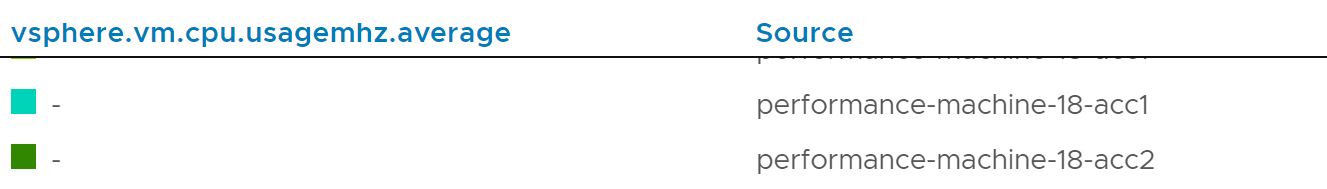
- Rename all the sources beginning with “perf18” to “Performance-Machine-#”
- Capture everything after the perf18 that is a number and put that into the capture group.
The replacement pattern can use a variable, $1, to append the number to "Performance-Machine" as in this example:
aliasSource(ts("vsphere.vm.cpu.usagemhz.average",source=perf18*), "perf([0-9]*)", "Performance-Machine-$1")
Replace Metric Name with aliasMetric() and Regex
You can change the displayed metric name to a differen name using a search/replace regex. Use this syntax:
aliasMetric(<tsExpression>, [metric|source|{tagk,<pointTagKey>},"regexSearchPattern", "replacementPattern")
For example, assume you want to rename the metric CPU-Used-VM-11-verylongmetricname to CPU-Used-VM-11 The following regex:
- Searches and captures the first 14 characters of the metric.
- Uses those 14 characters in the replacement metric.
In this example,
${Original metric}ists("CPU-Used-VM-11-verylongmetricname").aliasMetric(${Original metric},"(.{0,14}).*", "$1")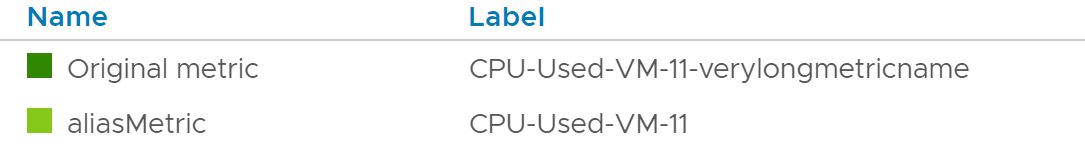
Replace Point Tag Name with taggify() and Regex
You can change the displayed point tags with taggify() and a search and replace regex. Use this syntax:
taggify(<tsExpression>, [metric|source|{tagk,<pointTagKey>},"regexSearchPattern", "replacementPattern" )
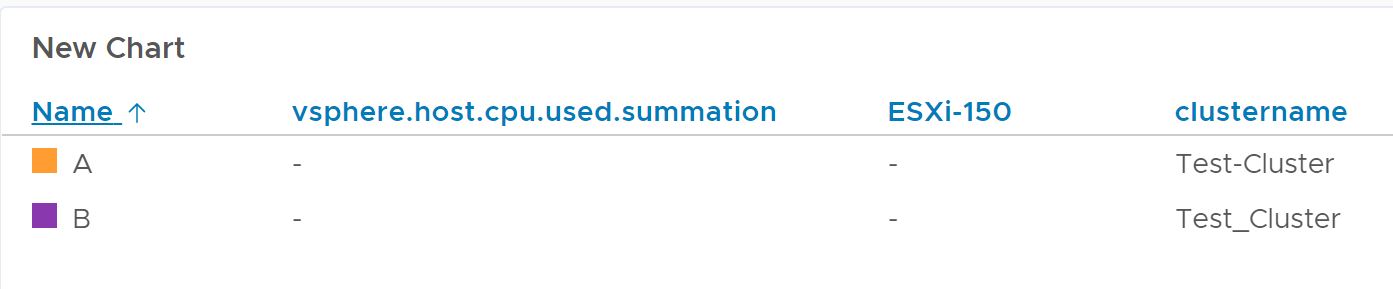
For example, to search and replace the values for the point tag clustername, from Test-cluster with a hyphen to Test_cluster with an underbar character, use this expression:
taggify(${A}, tagk, clustername, clustername, "-", "_")
In the screenshot below, the taggify search and replace operates on the point tag clustername (value is Test-Cluster and the result is Test_Cluster.
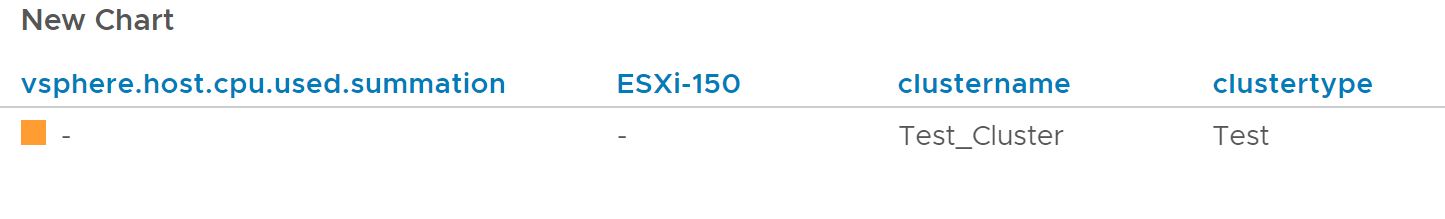
You can also use a search and replace operation on a point tag and create a new point tag from the results, for example to create a new point tag called “clustertype” using point tag values found in “clustername”, like this:
taggify(${B}, tagk, clustername, clustertype, "(.{0,4}).*", "$1")
Here, variable ${B} is taggify(${A}, tagk, clustername, clustername, "-", "_") and we see the new point tag clustertype with the value Test.
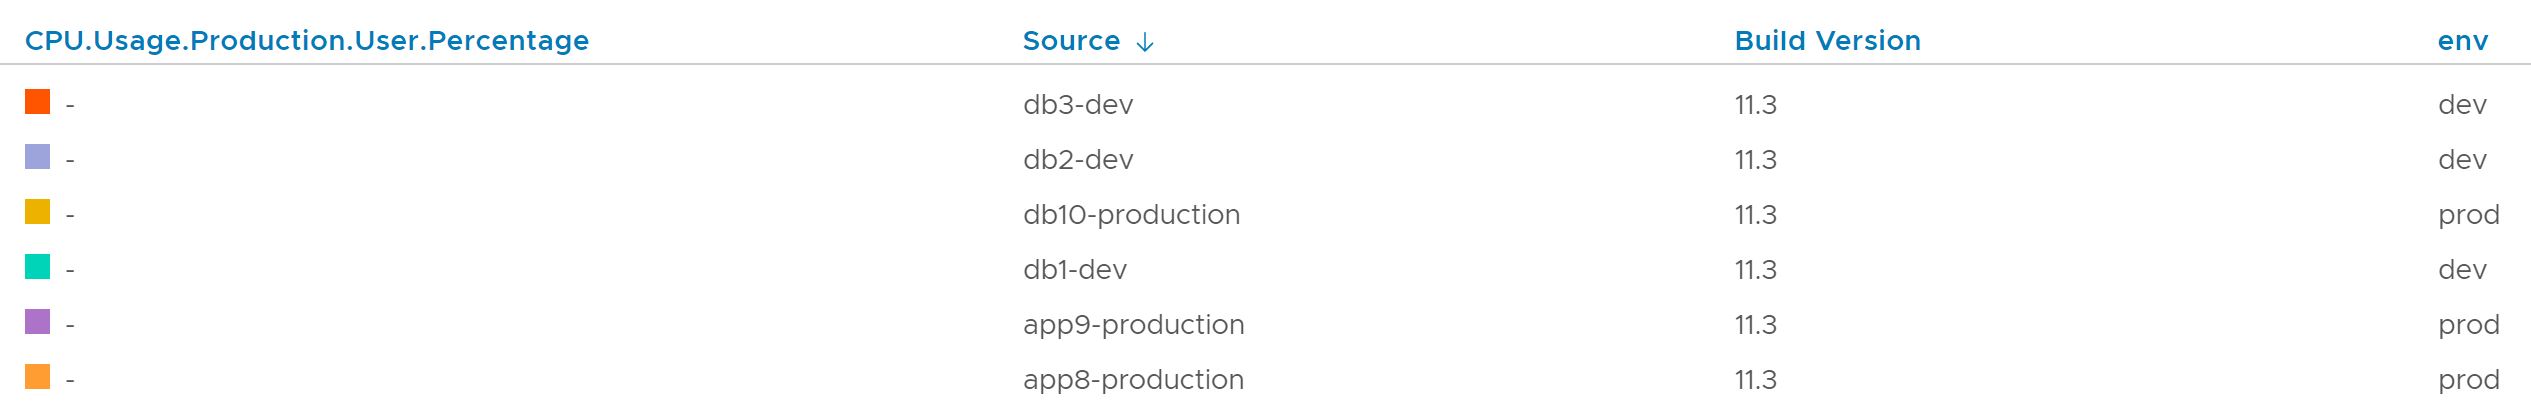
Nesting Metadata Functions
Metadata functions (aliasSource, aliasMetric, and taggify) can be nested to provide flexible manipulation of the content displayed on screen in the charts and dashboards.
For example, consider the metric ~sample.cpu.usage.user.percentage, which has sources db-[0-9] and app[0-9]. Assume you want:
- Alter the displayed sources so that they display as
app-x-production,db-x-devetc - Show the metric name as
CPU.Usage.Production.User.Percentagealong with some additional point tags like build version:11.3 - Abbreviate
envpoint tag
You can use the following sequence of queries.
| Query | What it does | |
|---|---|---|
| A | aliasSource(ts(~sample.cpu.usage.user.percentage), "app-([0-9]*)", "app$1-{{env}}") |
Converts the source names for application machines, app-[0-9] to app-[0-9]-dev, app-[0-9]-production etc. |
| B | aliasSource(${A}, "db-([0-9]*)", "db$1-{{env}}") |
Converts the source names for the db machines, db-[0-9] to db-[0-9]-dev, db-[0-9]-production etc. |
| C | aliasMetric(${B},"CPU.Usage.Production.User.Percentage") |
Converts the metric name ~sample.cpu.usage.user.percentage to CPU.Usage.Production.User.Percentage |
| D | taggify(${C},"Build Version", "11.3") |
Adds a Build Version point tag (value 11.3) |
| E | taggify(${D},tagK,env,env,"(.{0,4}).*", "$1") |
Shortens the env point tag to max 4 characters. |