Tanzu Observability supports two methods for sending log data metrics to a Wavefront proxy: Filebeat and TCP. Wavefront proxy 4.4 and later supports these methods.
Warning Log ingestion functionality does not work well if you use a load balancer in your environment.
- When traffic is split between nodes, each node tracks its own counter. The counters collide when they are sent to Tanzu Observability.
- Information about the actual source (host) is lost.
The Create Metrics from Logs for Real-Time Cloud Application Monitoring blog post discusses a real example and complements this page.
Installing and Configuring a Wavefront Proxy
The built-in Log Data integration guides you through installing a Wavefront proxy. To access this integration:
- Log in to your service instance.
- Click Integrations and click the Log Data tile.
- Click the Setup tab and follow the instructions.
Configuring the Wavefront Proxy to Ingest Log Data
In this example, we configure Tanzu Observability to parse Combined Apache Logs, which is a common logging format for many web services (for example, NGiNX). The example is merely a starting point— so you understand how to ingest metrics from any log format.
Configuring the Wavefront Proxy to Listen for Log Data
In your Wavefront proxy configuration file, add these new entries:
filebeatPort=5044
rawLogsPort=5045
logsIngestionConfigFile=<wavefront_config_path>/logsIngestion.yaml
These entries instruct the Wavefront proxy to listen for log data:
- On port 5044 it listens using the Lumberjack protocol, which works with Filebeat
- On port 5045 it listens for raw logs data over a TCP socket as a UTF-8 encoded string (which works with Splunk, and many others)
Configuring the Wavefront Proxy to Add Structure to Log Data
You use grok patterns (similar to Logstash) to add structure to your log data. To do this:
- Open the
logsIngestion.yamlfile you specified in the proxy configuration file. The file may be empty. - Add the following snippet, which gives instructions for parsing log data:
aggregationIntervalSeconds: 5  # Metrics are aggregated and sent at this interval
counters:
  - pattern: '%{COMBINEDAPACHELOG}'
    metricName: 'combined_apache_log_lines'  # +1 for every log line matching this pattern
gauges:
  - pattern: '%{COMBINEDAPACHELOG}'
    metricName: 'apacheStatus'
    valueLabel: 'response'  # Which value should be pulled from the COMBINEDAPACHELOG grok? Instantaneous value of most recently parsed HTTP return response code.
histograms:
  - pattern: '%{COMBINEDAPACHELOG}'
    metricName: 'responseBytes'
    valueLabel: 'bytes'
  # A helpful example below, this one won't parse any nginx logs.
  - pattern: 'My operation took %{NUMBER:duration} seconds'
    metricName: 'myOperationDuration'
    valueLabel: 'duration'
This configuration file is parsed as a POJO; see the javadoc for more details on each field. Log lines are given structure with java-grok, which is the syntax for the Logstash grok plugin.
Through valueLabel, you can specify which part of the log line contains the metrics to send. There are three supported modes of aggregation: counters, gauges, and histograms. See Dropwizard documentation for details.
You can think of a grok pattern as a regexe with macros. Each macro can consist of sub-macros, and each macro can bind a substring to a label. For example:
LOGLEVEL (INFO|WARNING|ERROR)
BASE_FORMAT %{LOGLEVEL:level} %{NUMBER:timestamp}
FULL_FORMAT %{BASE_FORMAT} my operation took %{NUMBER:value} seconds.*
FULL_FORMAT above would match a log line such as:
INFO 1476925272 my operation took 42 seconds (and other info here)
In the example above, the log message has a timestamp. You can use this timestamp to match the message for ingestion, but Tanzu Observability always ingests the resulting metric at the time the Wavefront proxy sees the log, not at the time the message was logged in your system. Therefore, the resulting metric would be: myOperationDuration 42 <proxy time> source=<host>
The Wavefront proxy includes these patterns and you can always add more.
Notes on Specifying Grok Patterns
- Bugs in grok patterns can be frustrating to debug. Try your grok pattern with a sample log line in one of the grok parsing debugger tools.
- As in the examples above, use single quotes unless you need double quotes. YAML parsers escape sequences inside double quotes, which is usually not what you want (e.g. “\n” will be the newline character).
- Remember that grok patterns expand to regex patterns. If you want to capture a number inside brackets, you need
'\[NUMBER:myNum\]'or"\\[NUMBER:myNum\\]"(for the above bullet). A regex debugger may be helpful. - The Wavefront proxy javadoc contains advanced grok examples.
Testing Grok Patterns in Interactive Mode
To test grok patterns before sending data, you can run the proxy in test mode where it reads lines from stdin and prints the generated metric when there is a match with a pattern in logsIngestionConfig.yaml. How you run the proxy in test mode depends on whether you’re using the JVM bundled with the Wavefront proxy. In that case, if the proxy installer detects that java v8, 9, 10 or, 11 already exists in the users path that version of Java is used.
To run in test mode with the bundled VM:
java -jar /opt/wavefront/wavefront-proxy/bin/wavefront-push-agent.jar -f /etc/wavefront/wavefront-proxy/wavefront.conf --testLogs < foo.txt
To run in test mode and specify the path explicitly:
/opt/wavefront/wavefront-proxy/proxy-jre/bin/java -jar /opt/wavefront/wavefront-proxy/bin/wavefront-push-agent.jar \
  -f /etc/wavefront/wavefront-proxy/wavefront.conf --testLogs < foo.txt
For both cases, foo.txt has, e.g.
counter foo 42
...
You can also omit < foo.txt to use interactive terminal mode.
Updating Log Ingestion Configuration
Wavefront proxy hot loads the log ingestion configuration file while the proxy is running. To update the log ingestion configuration:
- Edit the log ingestion configuration file and save it.
-
To verify that the updated file loaded successfully, open the Wavefront proxy log file and look for a log message like:
` INFO: Loaded new config:
` If there is a problem with the updated configuration, you’ll see a log line like this:
`WARNING: Could not load a new logs ingestion config file, check above for a stack trace.`
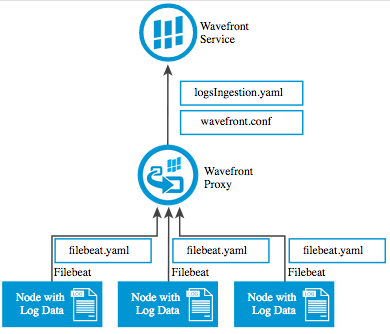
Sending Log Data to a Wavefront Proxy With Filebeat
You can send log data to a Wavefront proxy using Filebeat.
The Wavefront proxy automatically assigns metrics a source according to the machine that sent corresponding log data. This is done with Filebeat host metadata—so each host should be able to resolve its own hostname; otherwise the IP address is used.
Direct Log Ingestion Architecture (Filebeat)
Instructions
- Install Filebeat on any production node that has log data to send to Tanzu Observability:
-
Ubuntu:
$ curl -L -O https://artifacts.elastic.co/downloads/beats/filebeat/filebeat-5.0.1-amd64.deb $ sudo dpkg -i filebeat-5.0.1-amd64.deb -
Redhat:
$ curl -L -O https://artifacts.elastic.co/downloads/beats/filebeat/filebeat-5.0.1-x86_64.rpm
$ sudo rpm -vi filebeat-5.0.1-x86_64.rpm
-
-
The default config file is well commented and is in
/etc/filebeat/filebeat.yml. Edit the configuration file as needed. This deployment sends NGiNX logs to a Logstash worker:# Exhaustive example: https://raw.githubusercontent.com/elastic/filebeat/master/etc/filebeat.yml # Docs: https://www.elastic.co/guide/en/beats/filebeat/current/configuration-filebeat-options.html filebeat: prospectors: # Each - is a prospector. Below are the prospector specific configurations - paths: - /var/log/nginx/*.log input_type: log # You usually want tail_files: true. Wavefront shows the ingestion timestamp to be when a log line # was received, not when it was written to your logfile. For this reason, ingesting back-in-time # data will surprise you unless you are expecting that. tail_files: true # This is important if you have some kind of log rotator. Filebeat won't let go of an open FD # of a rotated file without this option. close_inactive: 5m registry_file: /var/lib/filebeat/registry output: logstash: # Even though we're sending directly to the Wavefront proxy, we use this. The protocol (Lumberjack) is the same. hosts: ["wavefront-proxy.mycompany.com:5044"] # Replace this with the host:port of your Wavefront proxy logging: to_syslog: false to_files: true files: path: /var/log/filebeat name: filebeat.log rotateeverybytes: 10485760 # = 10MB keepfiles: 7 # Available log levels are: critical, error, warning, info, debug level: info -
Start Filebeat:
$ sudo service filebeat restart -
To confirm that Filebeat is sending log data, run
$ tail -100 /var/log/filebeat/filebeat.logYou should see lines like this:
2016-10-19T22:27:32Z INFO Harvester started for file: /home/ubuntu/foo.log
2016-10-19T22:27:37Z INFO Events sent: 20048
2016-10-19T22:27:37Z INFO Registry file updated. 1 states written.
2016-10-19T22:27:40Z INFO Events sent: 20048
2016-10-19T22:27:40Z INFO Registry file updated. 1 states written.
2016-10-19T22:27:42Z INFO Events sent: 11647
In the Wavefront proxy log, log entries will indicate that the proxy is connected to Filebeat:
Nov 21, 2016 11:19:17 AM New filebeat connection
Filebeat keeps a registry file (in the above config, at /var/lib/filebeat/registry) that tells Filebeat where it left off in the event of a shutdown. To start from a clean state, stop Filebeat, clear this file, and start Filebeat.
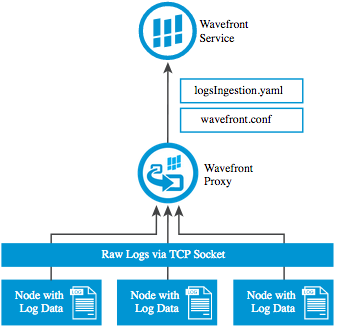
Sending Log Data to a Wavefront Proxy With TCP
This section describes how to send log data to a Wavefront proxy over a TCP socket. A typical use case would be to send Splunk data.
The Wavefront proxy automatically assigns metrics a source according to the machine that sent the log data. The proxy first tries a reverse DNS lookup; if that fails, the IP address is used.
Direct Log Ingestion Architecture (Raw TCP / Splunk)
Instructions
These instructions are tailored for Splunk integration, but you can send any newline-separated payload to the Wavefront proxy.
Forward data to third-party systems shows how you can fork your log data from Splunk to a third-party system. Add the following to your outputs.conf file:
[tcpout]

[tcpout:fastlane]
server = <wavefront_proxy_ip_address>:5045
sendCookedData = false
where <wavefront_proxy_ip_address> is the IP address of your Wavefront proxy.
Querying Log Data
After configuring the Wavefront proxy to send log data, you can issue queries such as:
rate(ts(combined_apache_log_lines))ts(responseBytes.p99)