Why Can’t I View and Edit This Alert?
By default, all users in VMware Tanzu Observability (formerly known as VMware Aria Operations for Applications) can view all alerts. But permissions and access control affect this default.
- You must have the Alerts permission to edit alerts. The Alerts permission applies to all alerts except ingestion policy alerts.
- Users with the Alerts permission can view, create, and modify alerts except ingestion policy alerts.
- Users who don’t have the Alerts permissions can only view alerts, including ingestion policy alerts.
- Users with the Ingestion Policies permission can edit an ingestion policy alert only by editing the corresponding ingesting policy.
- If an individual alert is protected by Access Control, you might not be able to edit or even view that alert.
- To view an alert that is under access control, you must have View access for the alert.
- To modify an alert that is under access control, you must have View & Modify access for this alert. You also need the Alerts permission.
The creator of the alert or a SuperAdmin user can grant access.
Why Did My Alert Not Fire?
You think that your alert should have fired, but it didn’t. There are two main reasons:
- The alert didn’t see the data that would have triggered the firing.
- There was a delay in reporting
- The checking frequency was long and the alert missed that the condition was met for Trigger Window amount of time.
- A function in the alert query changed the data so that the alert wasn’t triggered.
Here’s what you can do:
Check for Delayed Data Reporting
If you examine an alert that should have fired in the past, delayed data reporting might have caused the problem, especially if the data is delayed for longer than the alert trigger time window.
- The alert query might not have the data that would trigger the alert.
- A reporting lag can also reduce the set of data values being evaluated.
Examples
-
Consider an alert that has a trigger window of 1 minute, but the data it relies on typically arrives 3 minutes late. In this case, every time the alert is checked, it does not see any data in the trigger window, meaning the alert never fires. However, a user later checking the time series for the alert would see the data as it was backfilled after the alert check.
-
Consider an alert that is evaluating a 5-minute time window, but there is a 4-minute lag in reporting. In this case, the alert evaluates only 1 value during each check. Even if a TRUE value is going to eventually be followed by 4 FALSE values, the alert can still trigger if the FALSE values haven’t been reported into the system yet because alerts trigger when there is at least 1 TRUE value and no FALSE values.
Action
Here’s how you can take action:
- Review the alert query on a live data chart to find out if there’s lag in the reported data. 2.Refine your alert condition to prevent the alert from evaluating the query until data reporting is complete.
Investigate Checking Frequency and Trigger Window Mismatch
If the checking frequency interval is higher than the alert trigger time window, the alert might not fire.
Example
Suppose the Trigger Window interval is 5 minutes and the Checking Frequency interval is 10 minutes, data might meet the condition within the 5-minute time interval, but the alert never fires because the checking frequency interval is too high.
Action
Edit the alert to either change the Checking Frequency or Trigger Window.
Examine if Aggregation Masks Spikes or Dips
Aggregation can mask spikes or dips in your data in several ways.
-
Average aggregation: If your alert query is reporting values more often than once per minute, the query engine aggregates those values using an average. This default average aggregation can mask irregularities with data that should have triggered the alert.
-
Non-raw aggregation functions: With non-raw aggregation, the process of interpolation can increase a displayed value in the past by including more made-up values in the calculation once a newly reported value comes into the system.
Example
Imagine you are using sum() to aggregate 3 time series. Each time series reports a value every 5 minutes, but the reporting interval is staggered. In this case:
- app-1 reports on the :00 and :05 minute boundaries
- app-2 reports on the :01 and :06 minute boundaries
- app-3 reports on the :02 and :07 minute boundaries.
Assume you review this data in real time at 12:02pm.
- The aggregated value at 12:00pm represents the sum of 3 values because the query engine generates interpolated values at 12:00pm for app-2 and app-3.
- However, the value at 12:02pm only represents the sum of 1 value. The query engine can’t generate interpolated values for app-1 or app-2 because the next reported values have not come in yet.
In this scenario, your most recent aggregated values at the time of the alert evaluation are typically less than the value you’d expect to see for all 3 time series.
- The temporary lower values can fall below a specified limit or condition and cause an alert not to fire.
- But reviewing the data after the fact might show they exceed a limit due to interpolation.
Action
- Consider using missing data functions or raw aggregation functions can help in these cases.
- Consider applying the align() function to the entire alert condition and fine-tune based on what nuance you want your alert condition query to capture. For example, query on the last value reported, the sum of the values, or the minimum or maximum value of the data points.
Why Did My Alert Misfire?
False positive alerts can be a big problem because they can lead to alert fatigue–the alert recipients stop paying attention to alerts. Reasons for false positive are similar to reasons for the alert firing.
- The alert sees data that meet the alert condition. However, the actual data changed so the condition wasn’t met for a long enough time.
- Functions in the alert query make it look as if the condition was met for the Trigger Window time.
Here are some things you can do:
Check for Delayed Data Reporting
Reporting delays can prevent an alert from firing, or can make an alert misfire (false positive). Here, the alert might see a trigger value for the Trigger Window amount of time, but the value already changed at the source. The reporting delay causes the alert to fire. See Check for Delayed Data Reporting.
Check if the Alert Condition Query Uses Interpolation
Interpolation is useful in many ways, but it means that the raw data that come in isn’t the same as the data that the query engine sees. As a result, alerts can fail to fire (discussed above) or can fire even though the condition isn’t actually met.
Some functions, such as if(), non-raw aggregation function like sum(), and operators (+ or -) perform interpolation. With interpolation, the query engine generates a data value for one or more time series. Interpolation occurs between two reported values within a series.
If a query uses non-raw aggregation functions, interpolation can increase a displayed value in the past by including more made-up values in the calculation when a newly reported value is ingested.
Example
Imagine you are using sum() to aggregate 3 time series. Each time series reports a value every 5 minutes, but the reporting interval is staggered. In this case:
- app-1 reports on the :00 and :05 minute boundaries.
- app-2 reports on the :01 and :06 minute boundaries.
- app-3 reports on the :02 and :07 minute boundaries.
If we were reviewing this data in real-time at 12:02p, then the aggregated value at 12:00p would represent the sum of 3 values. This occurs because Tanzu Observability could generate interpolated values at 12:00p for app-2 and app-3. However, the value displayed at 12:02p would only represent the sum of 1 value. This is because Tanzu Observability can’t generate interpolated values for app-1 or app-2 at that boundary because the next reported values have not come in yet for either.
In this scenario, your most recent aggregated values at the time of the alert evaluation are going to typically be less than the value you’d expect to see if all 3 time series were accounted for. These temporary lower values can often fall below a specified limit or condition and cause an alert not to fire, but reviewing the data after the fact may show them exceed that specified limit due to interpolation.
Action
Using missing data functions or raw aggregation functions (like rawsum()) can solve the problem in these cases.
Any Tips for Creating an Alert that Works Well?
Creating an alert isn’t hard, but creating an effective alert is less trivial. Here are some tips from our SaaS Value Engineering team.
Consider How Your Alert Will Evaluate the Condition
The query engine evaluates the reported value against the alert condition for each minute in the checking interval. If your metric reports more than one value during a particular minute, the query engine first performs an average aggregation of the values for that minute, and then evaluates the aggregated value against the alert condition.
- If the alert condition is met or returns a non-zero value, the result is TRUE.
- If the alert condition is not met or returns a zero value, the result is FALSE.
- If there’s no data reported during the minute, there’s no result from the evaluation.
Let’s look at an example over a single minute in the checking interval. Suppose your alert condition is ts(my.metric) > 8.
- If
my.metricreported the data value of15during the minute, the query engine evaluates the alert condition for this minute as TRUE because the condition is met, i.e. the statement15 > 8is TRUE. - If
my.metricreported the data values of15,6, and2during the minute, the query engine evaluates the alert condition for this minute as FALSE because the condition for the aggregated average value is not met, i.e. the statement7.6 > 8is FALSE.
After the alert evaluation, Tanzu Observability has a list of N minutely values, one value for each minute in the checking interval. Each of the N values can be TRUE, FALSE, or NO DATA.
Explore When Your Alert Will Fire
If the alert condition returned at least one true value and no false minutely values during the alert trigger window, the alert state changes from CHECKING to FIRING.
The default Trigger Window is 5 minutes. You can adjust this property during alert creation or edit the alert later.
If your metric is backfilled in chunks, for example, if the metric is backfilled in 10-minute chunks, avoid setting Trigger Window to less than 10 minutes, or use a moving time window function to make sure that all the incoming data is visible to the alert.
Understand When Your Firing Alert Will Resolve
If the alert condition didn’t return any true minutely values during the alert resolve window, the alert state changes FIRING to CHECKING.
The default Resolve Window value is the same as the Trigger Window value. You can adjust this property when you create the alert or edit the alert later.
Use Aggregation to Alert on Points from Different Time Series
You can aggregate points from multiple time series with or without interpolation depending on your use case. Interpolation is the process of generating a made-up data value for one or more time series where they don’t exist, and can only occur between two truly reported values within a series.
If metrics report at the same time, it might be better to use raw aggregate functions and not interpolating aggregate functions. With standard aggregation functions, interpolation will occur.
What if a Metric Doesn’t Report Values for a Long Time?
If your alert monitors an exception metric, the alert might not see any data during its trigger window and enters the NO DATA state. For example, suppose your alert condition query is ts(bad.exception), where the bad.exception metric reports a value of 1 when an exception occurs and reports no data when there’s no exception happening.
In such cases, use one of the following approaches:
- Consider the NO DATA state to be normal and take action only when the alert triggers to FIRING, which means the alert sees the presence of reported error data.
Note: By default, obsolete metrics are not included in alert evaluation. To handle alerting on very infrequently reported errors series, on the Advanced tab of the Data settings of the alert, select the Include Obsolete Metrics check box.
- Use the default() missing data function to insert a default value depending on how you want to handle the situation where data isn’t being reported.
- Send in your data as a counter metric (instead of a gauge) and query with a
cs()query. Counter metrics are cumulative and do not become obsolete. For example, use thebad.exception.countmetric rather than thebad.exceptionmetric.
How Do I Bulk Update Alerts with the API?
There are times when you may want to update multiple alerts in the same way, for example, you might want to remove a user from all alert notifications or replace that user in alert notifications.
The best practice for handling alert notifications is to use Alert Targets rather than specify specific emails or PagerDuty keys while editing an alert. If an alert target specifies the notification target, then you can easily update the alert target. In contrast, you’d have to modify each alert that uses an email or a PagerDuty key – bulk updates aren’t possible.
You can bulk update alerts with the API, discussed in this section, or with the wf CLI.
Prerequisites
Before you start the update:
-
Identify what needs to be updated across all the alerts of interest. For instance, do you want to update the alert target or do you want to update the condition or the time to fire setting?
-
Have a process in place to update the field(s) that you want to update. This can be a script or find and replace with a text editing tool. The objects will be JSON.
Step 1: Extract the Alert IDs for the Alerts You Want to Update
Determine which alerts need to be updated. If you do not have this information already, you may need to run a search with the API to extract, at minimum, the alert IDs for the alerts of interest.
To run a search:
- Use the
POST /api/v2/search/alert/{facet}API endpoint. - Set the facet to id. In the payload.
- Use the query field to specify which alerts to filter for. Valid keys for the query are any of the property keys for an Alert JSON object.
- (Optional) If you are unsure of what the available property keys are, use the
GET /api/v2/alertendpoint and retrieve just one alert to see what the JSON looks like.
Example:
This example retrieves the IDs of all the alerts that have a name containing "prod". The query needs to page through the results to obtain the full set of results. The response has a set of IDs.
Request URL: https://<your_instance>.wavefront.com/api/v2/search/alert/id

Payload:

{
   "query": [
      {
         "key": "name",
         "value": "prod",
         "matchingMethod": "CONTAINS"
      }
   ]
}
Response:

{ "status": { "result": "OK", "message": "response limited to 10 items for performance", "code": 200 }, "response": { "items": [ "1600096964756", "940000000009", "940000000006", "940000000004", "940000000002", "940000000005", "940000000003", "940000000001" ], "offset": 0, "limit": 10, "totalItems": 8, "moreItems": false } }
Step 2: Obtain the JSON for Each Alert
Step 2 uses the GET /api/v2/alert/{id} API endpoint to obtain the JSON for each alert. The alert JSON is the data within the "response" field.
Example:

Request URL: https://<your_instance>.wavefront.com/api/v2/alert/1000000012345

Response:

{ "status": { "result": "OK", "message": "", "code": 200 }, "response": { "targetEndpoints": ["target:9R8xByg3rrJ4aiHt"], "modifyAclAccess": true, "hidden": false, "severity": "SEVERE", "minutes": 5, "name": "Example Prod Alert", "id": "1000000012345", "target": "target:9R8xByg3rrJ4aiHt", "status": [ "CHECKING" ], "tags": { "customerTags": [] }, "created": 1000000012345, "updated": 1000000012345, "hostsUsed": [], "orphan": false, "includeObsoleteMetrics": false, "lastQueryTime": 34, "alertType": "CLASSIC", "metricsUsed": [], "evaluateRealtimeData": false, "inTrash": false, "acl": { "canView": [], "canModify": [ "user@domain.com" ] }, "systemOwned": false, "condition": "ts(my.sample.data) < 1", "conditionQBEnabled": false, "displayExpression": "ts(my.sample.data)", "displayExpressionQBEnabled": false, "resolveAfterMinutes": 5, "failingHostLabelPairs": [], "additionalInformation": "", "inMaintenanceHostLabelPairs": [], "activeMaintenanceWindows": [], "updateUserId": "user@domain.com", "prefiringHostLabelPairs": [], "notificants": ["9R8xByg3rrJ4aiHt"], "createUserId": "user@domain.com", "lastProcessedMillis": 1614890662293, "processRateMinutes": 1, "pointsScannedAtLastQuery": 0, "alertsLastDay": 0, "alertsLastWeek": 0, "alertsLastMonth": 0, "numPointsInFailureFrame": 0, "creatorId": "user@domain.com", "updaterId": "user@domain.com", "createdEpochMillis": 1000000012345, "updatedEpochMillis": 1000000012345, "deleted": false, "targetInfo": [], "failingHostLabelPairLinks": [], "sortAttr": 840, "severityList": [ "SEVERE" ] } }
Step 3: Update the JSON
This step depends on what you want to do. For example, you could replace one user name with another user name, add one or more users, or perform other modifications.
Step 4: Update the Alert
You can now update each alert with the updated JSON. Use the PUT /api/v2/alert/{id} endpoint and include the updated alert JSON as the payload. After this is completed, you’ve successfully updated the alerts.
Example: This example updates the alert target. Notice in the response that the alert target IDs are now different.
Request URL: https://<your_instance>.wavefront.com/api/v2/alert/1000000012345

Payload: updated JSON from Step 3

Response:

{ "status": { "result": "OK", "message": "", "code": 200 }, "response": { "targetEndpoints": ["target:12345yg3rrJ4aiHt"], "modifyAclAccess": true, "hidden": false, "severity": "SEVERE", "minutes": 5, "name": "Example Prod Alert", "id": "1000000012345", "target": "target:12345yg3rrJ4aiHt", "status": [ "CHECKING" ], "tags": { "customerTags": [] }, "created": 1000000012345, "updated": 1000000098765, "hostsUsed": [], "orphan": false, "includeObsoleteMetrics": false, "lastQueryTime": 34, "alertType": "CLASSIC", "metricsUsed": [], "evaluateRealtimeData": false, "inTrash": false, "acl": { "canView": [], "canModify": [ "user@domain.com" ] }, "systemOwned": false, "condition": "ts(my.sample.data) < 1", "conditionQBEnabled": false, "displayExpression": "ts(my.sample.data)", "displayExpressionQBEnabled": false, "resolveAfterMinutes": 5, "failingHostLabelPairs": [], "additionalInformation": "", "inMaintenanceHostLabelPairs": [], "activeMaintenanceWindows": [], "updateUserId": "user@domain.com", "prefiringHostLabelPairs": [], "notificants": ["12345yg3rrJ4aiHt"], "createUserId": "user@domain.com", "lastProcessedMillis": 1614890662293, "processRateMinutes": 1, "pointsScannedAtLastQuery": 0, "alertsLastDay": 0, "alertsLastWeek": 0, "alertsLastMonth": 0, "numPointsInFailureFrame": 0, "creatorId": "user@domain.com", "updaterId": "user@domain.com", "createdEpochMillis": 1000000012345, "updatedEpochMillis": 1000000098765, "deleted": false, "targetInfo": [], "failingHostLabelPairLinks": [], "sortAttr": 840, "severityList": [ "SEVERE" ] } }
How Do I Bulk Update Alerts with the CLI?
The CLI makes the same underlying calls to the REST API as described above but simplifies the process for the end user.
Extract IDs and Find the JSON
The equivalent for the Step 1 and Step 2 above is:
wf alert search name~prod -f json -M > alert.json
This command exports the JSON for all the alerts with a name that contains prod.
Change the JSON and Apply the Changes
Next, you make the desired changes to the alert JSON and save that file with a new name. Assuming alert-updated.json is the updated file, the equivalent for Step 4 above is:
wf alert import alert-updated.json
There are times when you may want to update multiple alerts in the same way, for example, you might want to remove a user from all alert notifications or replace that user in alert notifications.
The best practice for handling alert notifications is to use Alert Targets rather than specify specific emails or PagerDuty keys while editing an alert. If an alert target specifies the notification target, then you can easily update the alert target. In contrast, you’d have to modify each alert that uses an email or a PagerDuty key – bulk updates aren’t possible with the GUI.
You can bulk update alerts with the REST API, discussed in this section, or with the wf CLI.
Prerequisites
Before you start the update:
-
Identify what needs to be updated across all the alerts of interest. For instance, do you want to update the alert target or do you want to update the condition or the time to fire setting?
-
Have a process in place to update the field(s) that you want to update. This can be a script or find and replace with a text editing tool. The objects will be JSON.
Step 1: Extract the Alert IDs for the Alerts You Want to Update
Determine which alerts need to be updated. If you do not have this information already, you may need to run a search with the API to extract, at minimum, the alert IDs for the alerts of interest.
To run a search:
- Use the
POST /api/v2/search/alert/{facet}API endpoint. - Set the facet to id. In the payload.
- Use the query field to specify which alerts to filter for. Valid keys for the query are any of the property keys for an Alert JSON object.
- (Optional) If you are unsure of what the available property keys are, use the
GET /api/v2/alertendpoint and retrieve just one alert to see what the JSON looks like.
Example:
This example retrieves the IDs of all the alerts that have a name containing "prod". The query needs to page through the results to obtain the full set of results. The response has a set of IDs.
Request URL: https://<your_instance>.wavefront.com/api/v2/search/alert/id

Payload:

{
   "query": [
      {
         "key": "name",
         "value": "prod",
         "matchingMethod": "CONTAINS"
      }
   ]
}
Response:

{ "status": { "result": "OK", "message": "response limited to 10 items for performance", "code": 200 }, "response": { "items": [ "1600096964756", "940000000009", "940000000006", "940000000004", "940000000002", "940000000005", "940000000003", "940000000001" ], "offset": 0, "limit": 10, "totalItems": 8, "moreItems": false } }
Step 2: Obtain the JSON for Each Alert
Step 2 uses the GET /api/v2/alert/{id} API endpoint to obtain the JSON for each alert. The alert JSON is the data within the "response" field.
Example:

Request URL: https://<your_instance>.wavefront.com/api/v2/alert/1000000012345

Response:

{ "status": { "result": "OK", "message": "", "code": 200 }, "response": { "targetEndpoints": ["target:9R8xByg3rrJ4aiHt"], "modifyAclAccess": true, "hidden": false, "severity": "SEVERE", "minutes": 5, "name": "Example Prod Alert", "id": "1000000012345", "target": "target:9R8xByg3rrJ4aiHt", "status": [ "CHECKING" ], "tags": { "customerTags": [] }, "created": 1000000012345, "updated": 1000000012345, "hostsUsed": [], "orphan": false, "includeObsoleteMetrics": false, "lastQueryTime": 34, "alertType": "CLASSIC", "metricsUsed": [], "evaluateRealtimeData": false, "inTrash": false, "acl": { "canView": [], "canModify": [ "user@domain.com" ] }, "systemOwned": false, "condition": "ts(my.sample.data) < 1", "conditionQBEnabled": false, "displayExpression": "ts(my.sample.data)", "displayExpressionQBEnabled": false, "resolveAfterMinutes": 5, "failingHostLabelPairs": [], "additionalInformation": "", "inMaintenanceHostLabelPairs": [], "activeMaintenanceWindows": [], "updateUserId": "user@domain.com", "prefiringHostLabelPairs": [], "notificants": ["9R8xByg3rrJ4aiHt"], "createUserId": "user@domain.com", "lastProcessedMillis": 1614890662293, "processRateMinutes": 1, "pointsScannedAtLastQuery": 0, "alertsLastDay": 0, "alertsLastWeek": 0, "alertsLastMonth": 0, "numPointsInFailureFrame": 0, "creatorId": "user@domain.com", "updaterId": "user@domain.com", "createdEpochMillis": 1000000012345, "updatedEpochMillis": 1000000012345, "deleted": false, "targetInfo": [], "failingHostLabelPairLinks": [], "sortAttr": 840, "severityList": [ "SEVERE" ] } }
Step 3: Update the JSON
This step depends on what you want to do. For example, you could change the alert thresholds for the different severities, or perform other modifications.
Step 4: Update the Alert
You can now update each alert with the updated JSON. Use the PUT /api/v2/alert/{id} endpoint and include the updated alert JSON as the payload. After this is completed, you’ve successfully updated the alerts.
Example: This example updates the alert target. Notice in the response that the alert target IDs are now different.
Request URL: https://<your_instance>.wavefront.com/api/v2/alert/1000000012345

Payload: updated JSON from Step 3

Response:

{ "status": { "result": "OK", "message": "", "code": 200 }, "response": { "targetEndpoints": ["target:12345yg3rrJ4aiHt"], "modifyAclAccess": true, "hidden": false, "severity": "SEVERE", "minutes": 5, "name": "Example Prod Alert", "id": "1000000012345", "target": "target:12345yg3rrJ4aiHt", "status": [ "CHECKING" ], "tags": { "customerTags": [] }, "created": 1000000012345, "updated": 1000000098765, "hostsUsed": [], "orphan": false, "includeObsoleteMetrics": false, "lastQueryTime": 34, "alertType": "CLASSIC", "metricsUsed": [], "evaluateRealtimeData": false, "inTrash": false, "acl": { "canView": [], "canModify": [ "user@domain.com" ] }, "systemOwned": false, "condition": "ts(my.sample.data) < 1", "conditionQBEnabled": false, "displayExpression": "ts(my.sample.data)", "displayExpressionQBEnabled": false, "resolveAfterMinutes": 5, "failingHostLabelPairs": [], "additionalInformation": "", "inMaintenanceHostLabelPairs": [], "activeMaintenanceWindows": [], "updateUserId": "user@domain.com", "prefiringHostLabelPairs": [], "notificants": ["12345yg3rrJ4aiHt"], "createUserId": "user@domain.com", "lastProcessedMillis": 1614890662293, "processRateMinutes": 1, "pointsScannedAtLastQuery": 0, "alertsLastDay": 0, "alertsLastWeek": 0, "alertsLastMonth": 0, "numPointsInFailureFrame": 0, "creatorId": "user@domain.com", "updaterId": "user@domain.com", "createdEpochMillis": 1000000012345, "updatedEpochMillis": 1000000098765, "deleted": false, "targetInfo": [], "failingHostLabelPairLinks": [], "sortAttr": 840, "severityList": [ "SEVERE" ] } }
How Do I Bulk Update Alerts with the CLI?
The CLI makes the same underlying calls to the REST API as described above but simplifies the process for the end user.
Extract IDs and Find the JSON
The equivalent for the Step 1 and Step 2 above is:
wf alert search name~prod -f json -M > alert.json
This command exports the JSON for all the alerts with a name that contains prod.
Change the JSON and Apply the Changes
Next, you make the desired changes to the alert JSON and save that file with a new name. Assuming alert-updated.json is the updated file, the equivalent for Step 4 above is:
wf alert import alert-updated.json
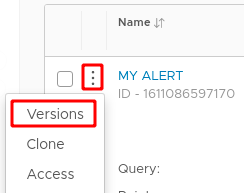
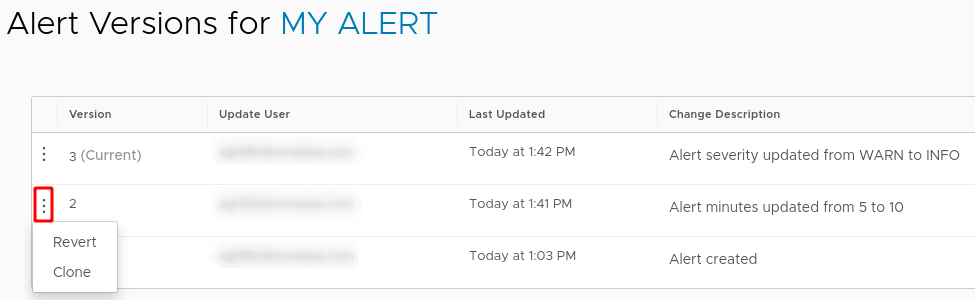
How Can I Audit Alert Changes?
Users need to audit alert changes in several situations:
- An alert was saved with incorrect changes and the previous configuration isn’t known.
- An alert was changed. An audit needs to determine when it was updated and by whom.
- An alert was deleted. Audit needs to determine when it was deleted and by whom.
Each time you save an alert, the alert version is updated internally. Up to 100 versions are supported.
To audit or restore an alert:
|
 |
How Do I Check the Logs Related to My Alerts?
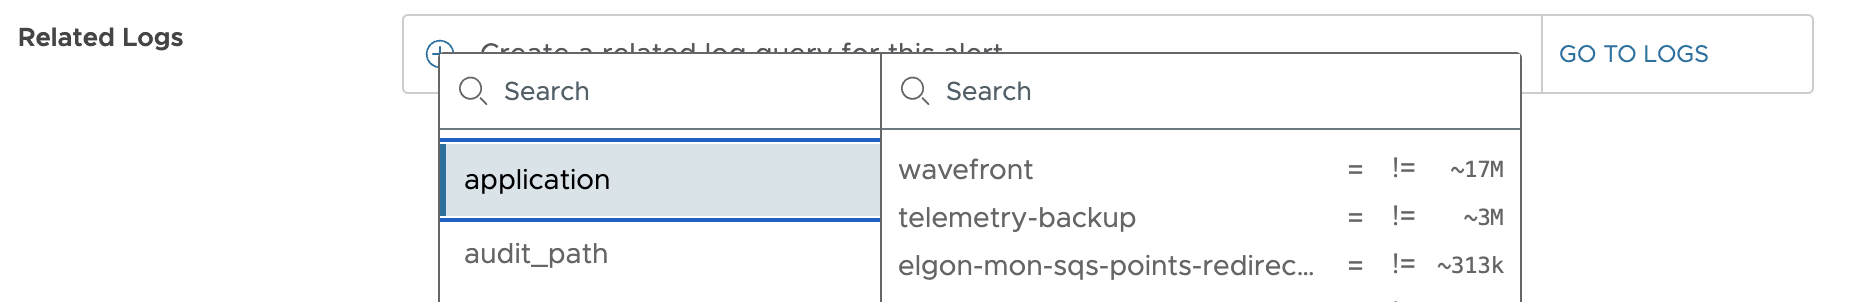
When you create or edit an alert, in the Related Logs panel, you can add multiple tag filters. This way, you can prepare the logs search query, which runs when the alert fires.
To drill into the related logs of a firing alert:
-
Go to the Alert Viewer for the alert. You have these options:
- Click the link in the alert notification.
- In the Alerts Browser, locate the firing alert and click View firing details.
- Click Show Logs Summary.
- In the Alert Log Summary panel, the
time rangefilter is populated with the trigger window during which the alert condition was met and the alert transitioned to a firing state. - The chart shows you the logs for the specific time grouped by the log level, such as, debug, trace, error, server, info, and warn.
- You also get to see the list of exceptions that were fired when the alert was fired. Click an exception to go to the Logs Browser and examine the logs that have the exception you selected.
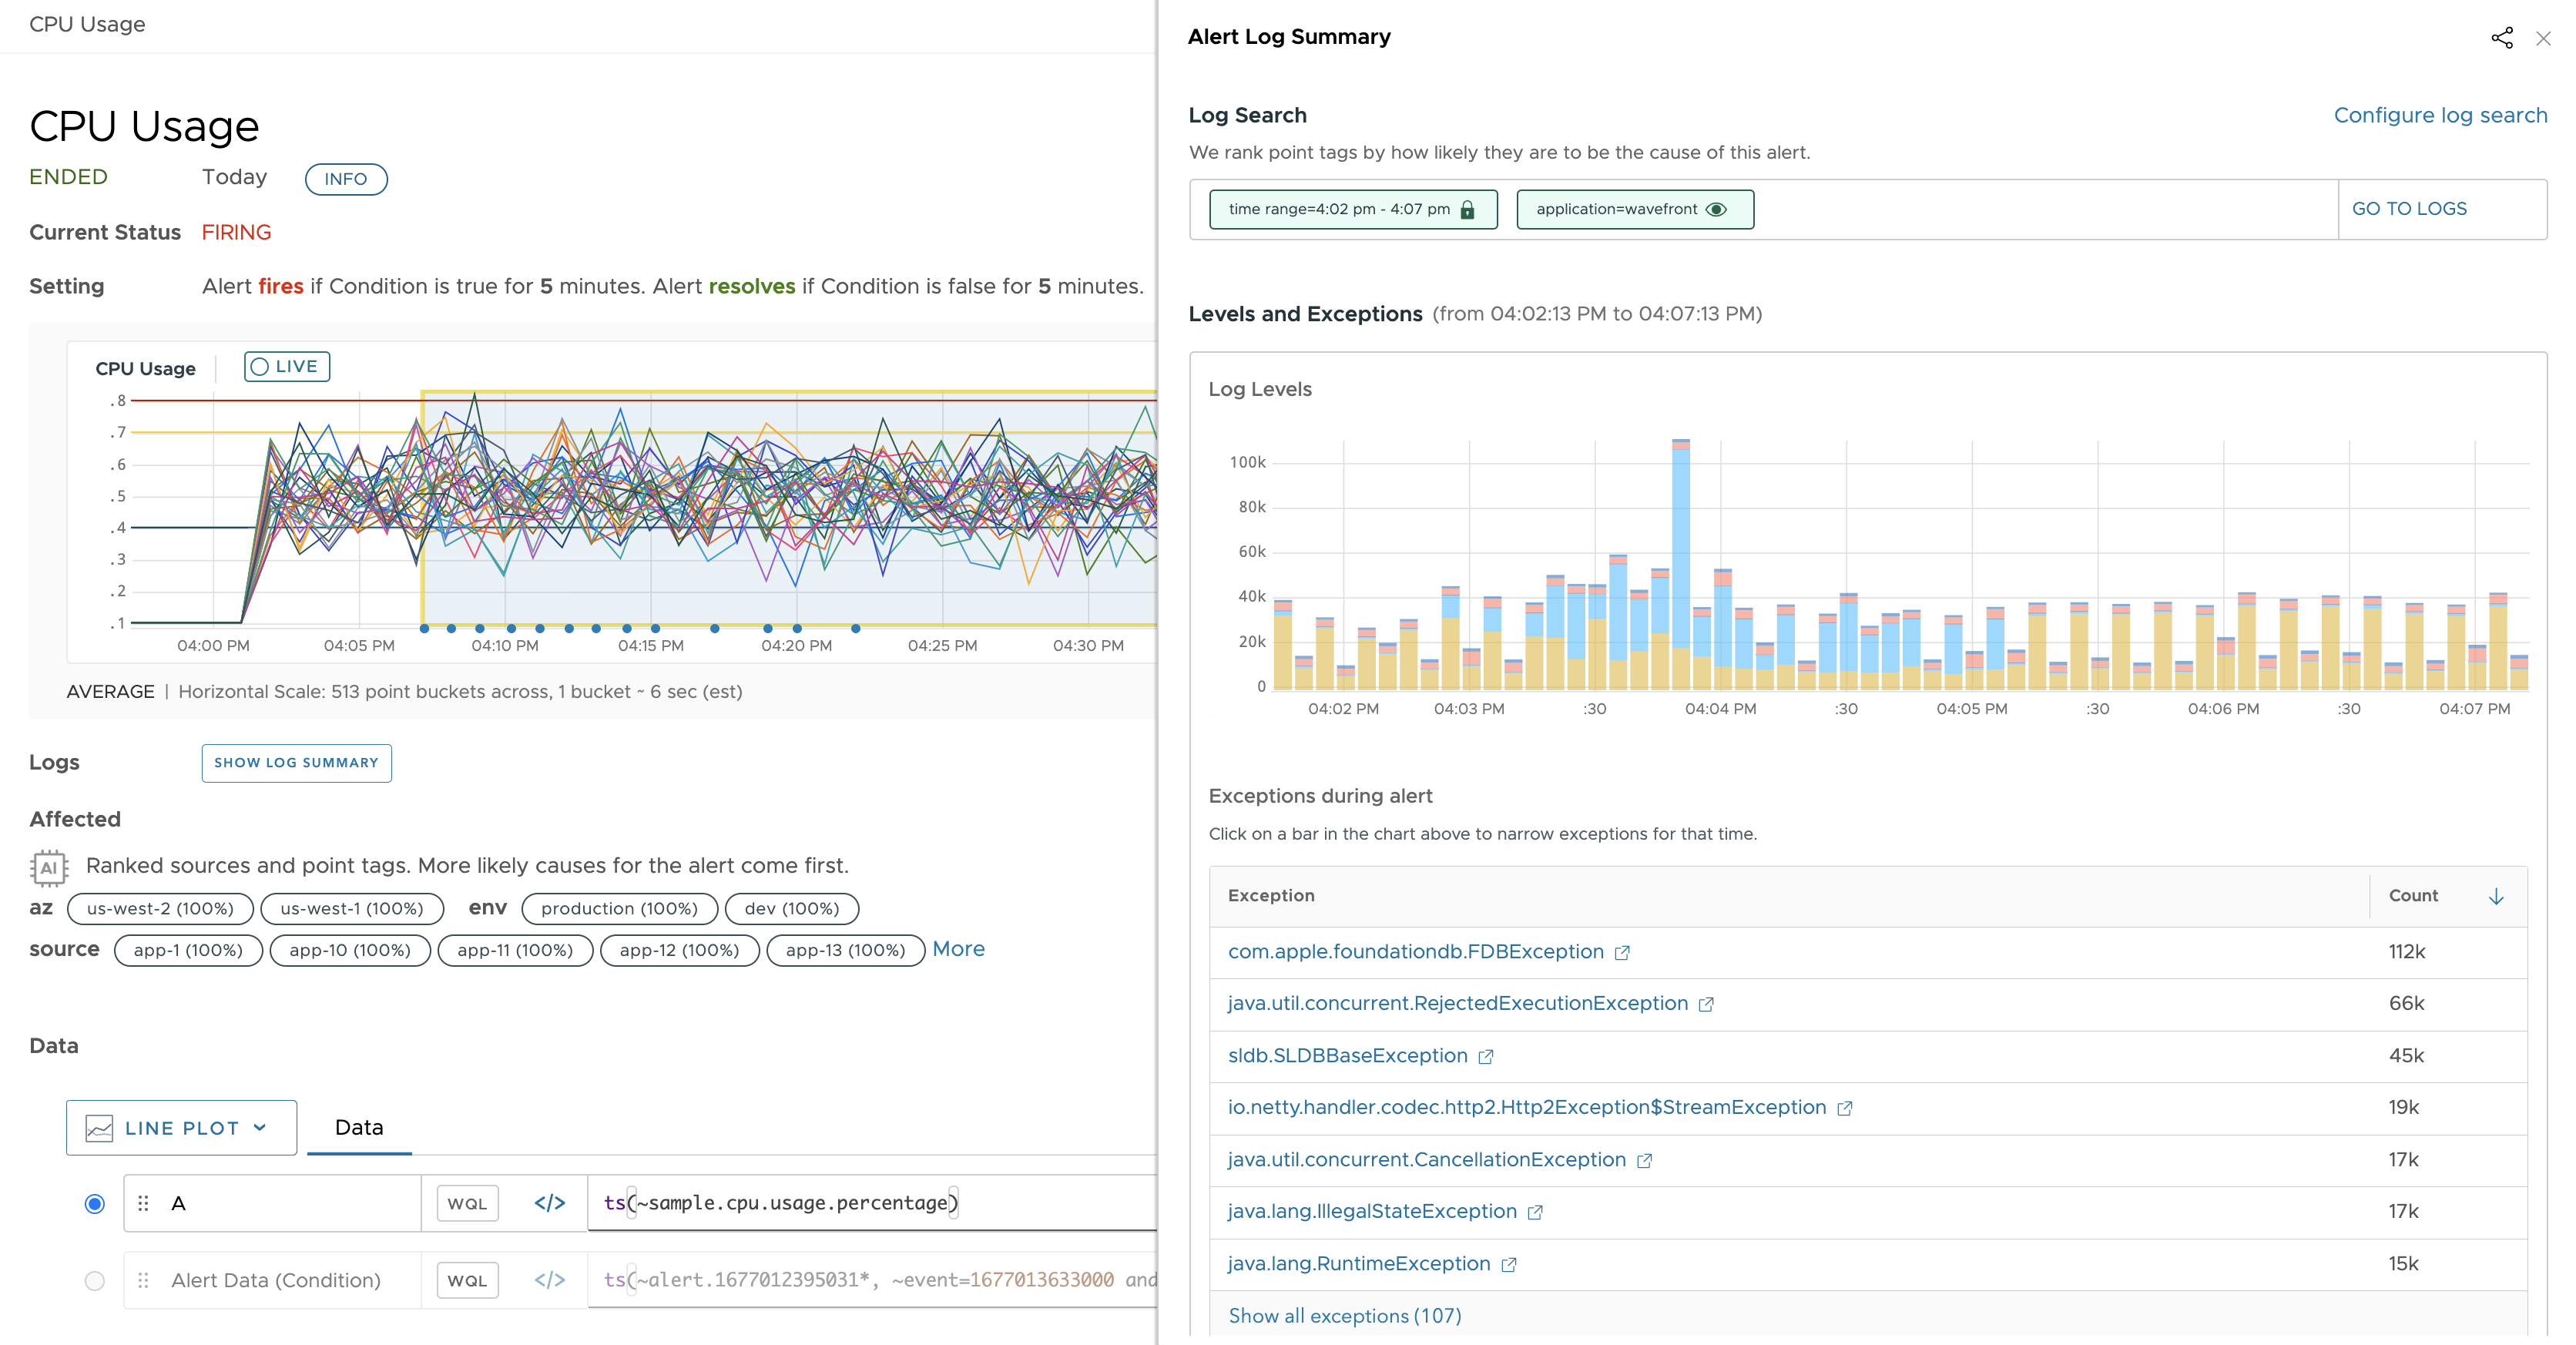
- In the Alert Log Summary panel, the
-
Optionally, in the Alert Log Summary panel, adjust the filters for the logs search query.
- Click Configure log search.
- Add and remove filters from the Related Logs section, and save the alert.
Click the eye icons of the related logs filters that you want to hide from the logs search query. To unhide a filter, you must click the eye-hide icon. You cannot remove or hide the
time rangefilter. -
In the Alert Log Summary panel, click Go to Logs. The Logs Browser opens in a new tab with the configurations from the Related Logs panel:
- The search time window corresponds to the
time rangevalue. - The search query contains the unhidden filters (with the eye icons).
- You can refine the Logs Browser search further with more filters or keywords and see the logs.
- The search time window corresponds to the
Where Can I Find the Logs Alerts I Created?
Follow these steps to see the log alerts you created:
- Log in to your product instance as a user with the Alerts and Logs permissions.
- On the toolbar, click Alerting > All Alerts.
- Click the Logs Alert tab. You see the logs alerts you created.
To lear more, see Manage Alerts for Logs.
Learn More
- How Alerts Work includes a video and discusses the anatomy of an alert (condition, target, notification)
- Alerts Best Practices has in-depth discussions on mapping your data to the right alert query, recommendations on alert settings, and more.
- Alert States and Lifecycle is required reading (and watching) for all power users.