In this tutorial, you use Wavefront for Spring Boot that uses Spring Boot 3 with the Spring pet clinic sample application. This tutorial sets dependencies explicitly. In most cases, it makes sense to use the Spring Initializr instead to explore supported combinations.
Prerequisites
- Spring Boot 3.0.0 or later.
- Java 17 or later.
- Maven 3.5+ or Gradle 7.5+ or later.
See System Requirements in the Spring Boot documentation. - Clone the sample petclinic application.
git clone https://github.com/spring-projects/spring-petclinic.git - Build the project and start it.
cd spring-petclinic ./mvnw spring-boot:run - Verify you can access the petclinic app at http://localhost:8080/.
Configure the Petclinic Application
-
Add the following configurations to the
pom.xmlfile in the sample petclinic application:- Import the Wavefront for Spring Boot Bill of Materials (BOM) to your project. Replace VERSION with the current version.
Tip:
Make sure that the Wavefront for Spring Boot dependency is compatible with the Spring Boot release version. See System Requirements to get the correct dependency version.
For example, if you are using Spring Boot release version 3.0.1, theVERSIONmust be 3.0.1.<dependencyManagement> <dependencies> <dependency> <groupId>com.wavefront</groupId> <artifactId>wavefront-spring-boot-bom</artifactId> <version>VERSION</version> <type>pom</type> <scope>import</scope> </dependency> </dependencies> </dependencyManagement> - Add the
wavefront-spring-boot-starterandmicrometer-registry-wavefrontdependencies.<dependency> <groupId>com.wavefront</groupId> <artifactId>wavefront-spring-boot-starter</artifactId> </dependency> <dependency> <groupId>io.micrometer</groupId> <artifactId>micrometer-registry-wavefront</artifactId> <scope>runtime</scope> </dependency> - Add the
micrometer-tracing-bridge-braveandmicrometer-tracing-reporter-wavefrontdependencies to send trace data to our service.<dependency> <groupId>io.micrometer</groupId> <artifactId>micrometer-tracing-bridge-brave</artifactId> </dependency> <dependency> <groupId>io.micrometer</groupId> <artifactId>micrometer-tracing-reporter-wavefront</artifactId> <scope>runtime</scope> </dependency> - Add the
datasource-micrometer-spring-bootdependency to intercept and log JDBC SQL queries. You can intercept most Connection, Statement, and ResultSet methods invocations using the Datasource Micrometer dependency.Tip:Check the Datasource Micrometer releases and enter the latest version in place of
VERSION.<dependency> <groupId>net.ttddyy.observation</groupId> <artifactId>datasource-micrometer-spring-boot</artifactId> <version>VERSION</version> <scope>runtime</scope> </dependency>
- Import the Wavefront for Spring Boot Bill of Materials (BOM) to your project. Replace VERSION with the current version.
-
Add the following configurations to the
application.propertiesfile so that your:- Application is named
spring-demo. - Service is named
spring-petclinic. - The probability of traces being sampled is set to 100% for demo purposes. To learn more on trace data sampling, see Trace Sampling.
 management.wavefront.application.name=spring-demo
 management.wavefront.application.service-name=spring-petclinic
 management.tracing.sampling.probability=1.0
- Application is named
Send Data to Our Service
-
Restart the application.
- Navigate to http://localhost:8080 and generate telemetry data from the petclinic user interface.
For example:
- Add an Owner and a Pet via the User Interface.
- Click VETERINARIANS to list vets in the database.
- Click ERROR to trigger errors.
- Copy the one-time use link that was printed on your terminal when you restarted your application to access the Wavefront for Spring Boot Service Dashboard and view data.
Tip: Make sure to save the one-time use link so you can access the same dashboard each time you restart your application.
Example output on your terminal:
 To share this account, make sure the following is added to your configuration:

    management.wavefront.api-token=1111-your-token-aaaa1111
    management.wavefront.uri=https://wavefront.surf

 Connect to your Wavefront dashboard using this one-time use link:
 https://wavefront.surf/us/ExaMPLe
Examine Data on the Spring Boot Inventory Dashboard
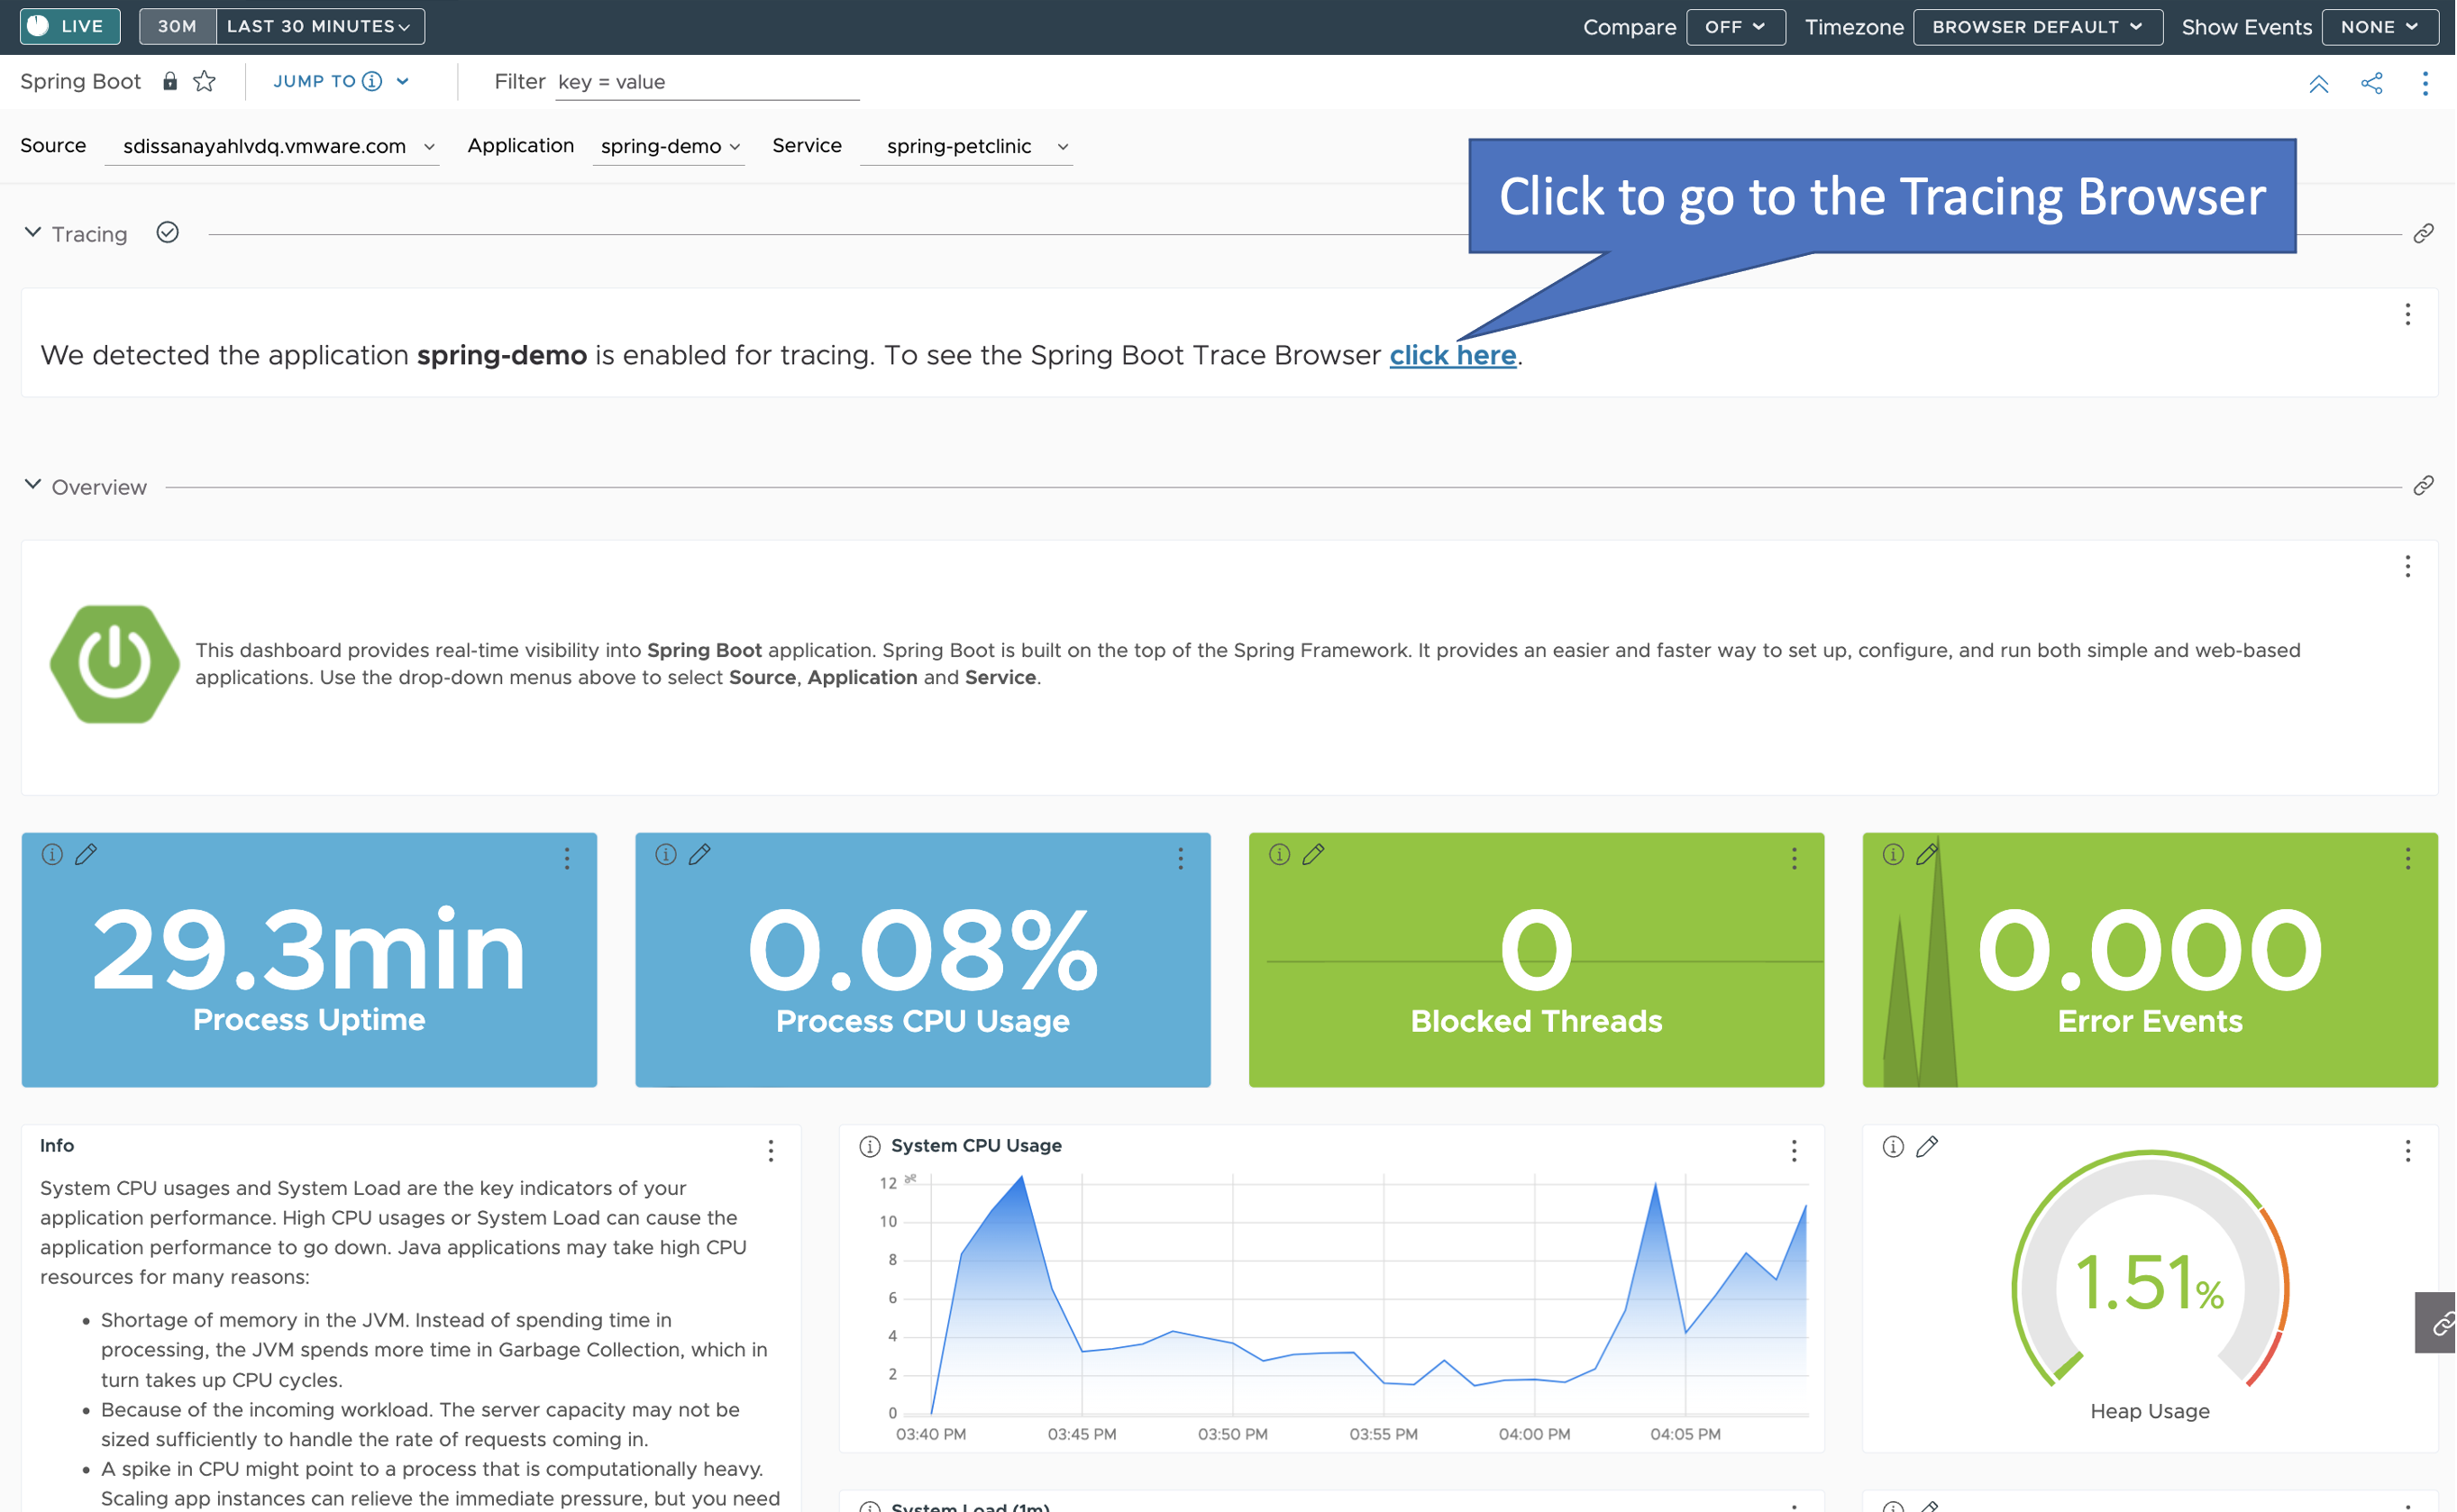
When you click the link in the Wavefront Spring Boot starter, you are taken to the Spring Boot Inventory dashboard. This dashboard provides real-time visibility into your Spring Boot application landscape. The dashboard has several sections that include the following charts:
- Status of hosts, applications, and services.
- Request rate.
- Inventory details.
- Hosts. Use the drop-down menus to group the hosts.
If one or more applications are enabled for tracing, click the link in the Tracing section to be directed to the Tracing dashboard.
Examine RED Metrics and Traces
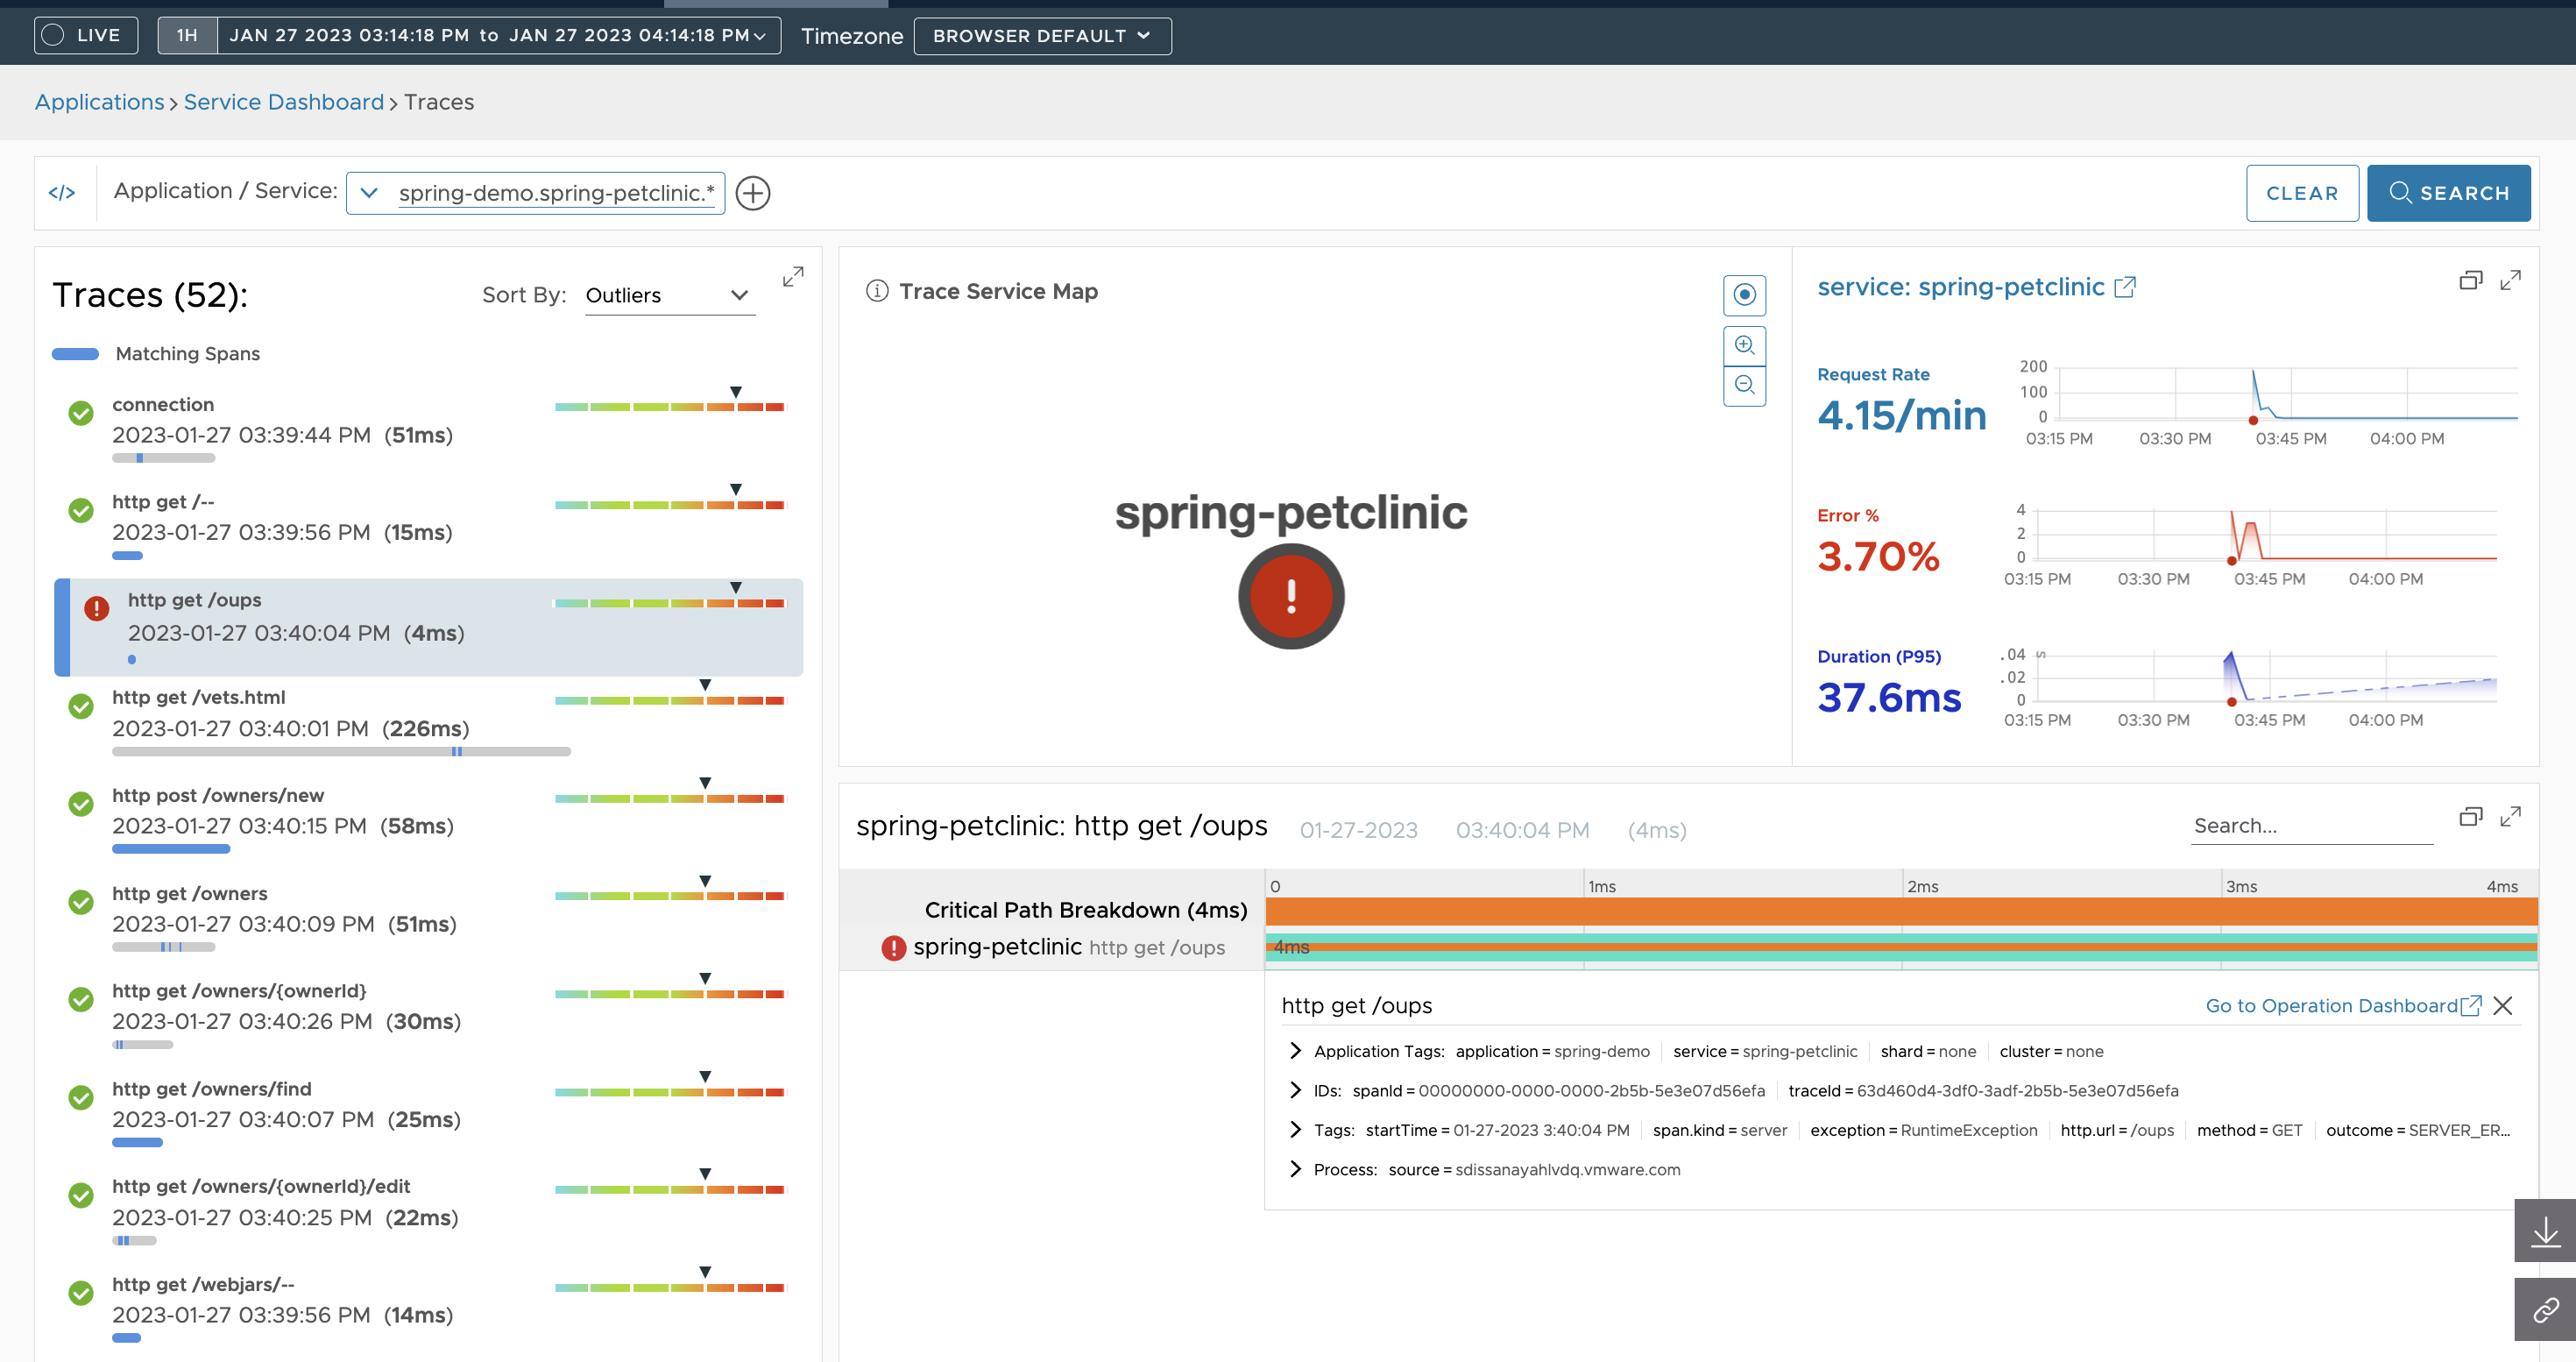
When you click the link in the Spring Boot Inventory dashboard, you are taken to the Spring Boot Traces Browser where you can:
- View the trace data of the
spring-petclinicservice.- Once in the Traces Browser, you see the traces from the application and the trace related to the error you created.
- If you configured your application to send trace data using OpenTracing, you can see span logs for the errors you triggered.
- View details specific to an application service, such as the Request, Error, and Duration (RED) metrics by clicking
 on the Traces Browser. See Explore the Default Service Dashboard for details.
Note:
on the Traces Browser. See Explore the Default Service Dashboard for details.
Note:
When your application sends data for the first time, they appear after about 1 minute. If you see data from the beachshirts sample application, refresh the page or go to Application > Application status to view the status of your application.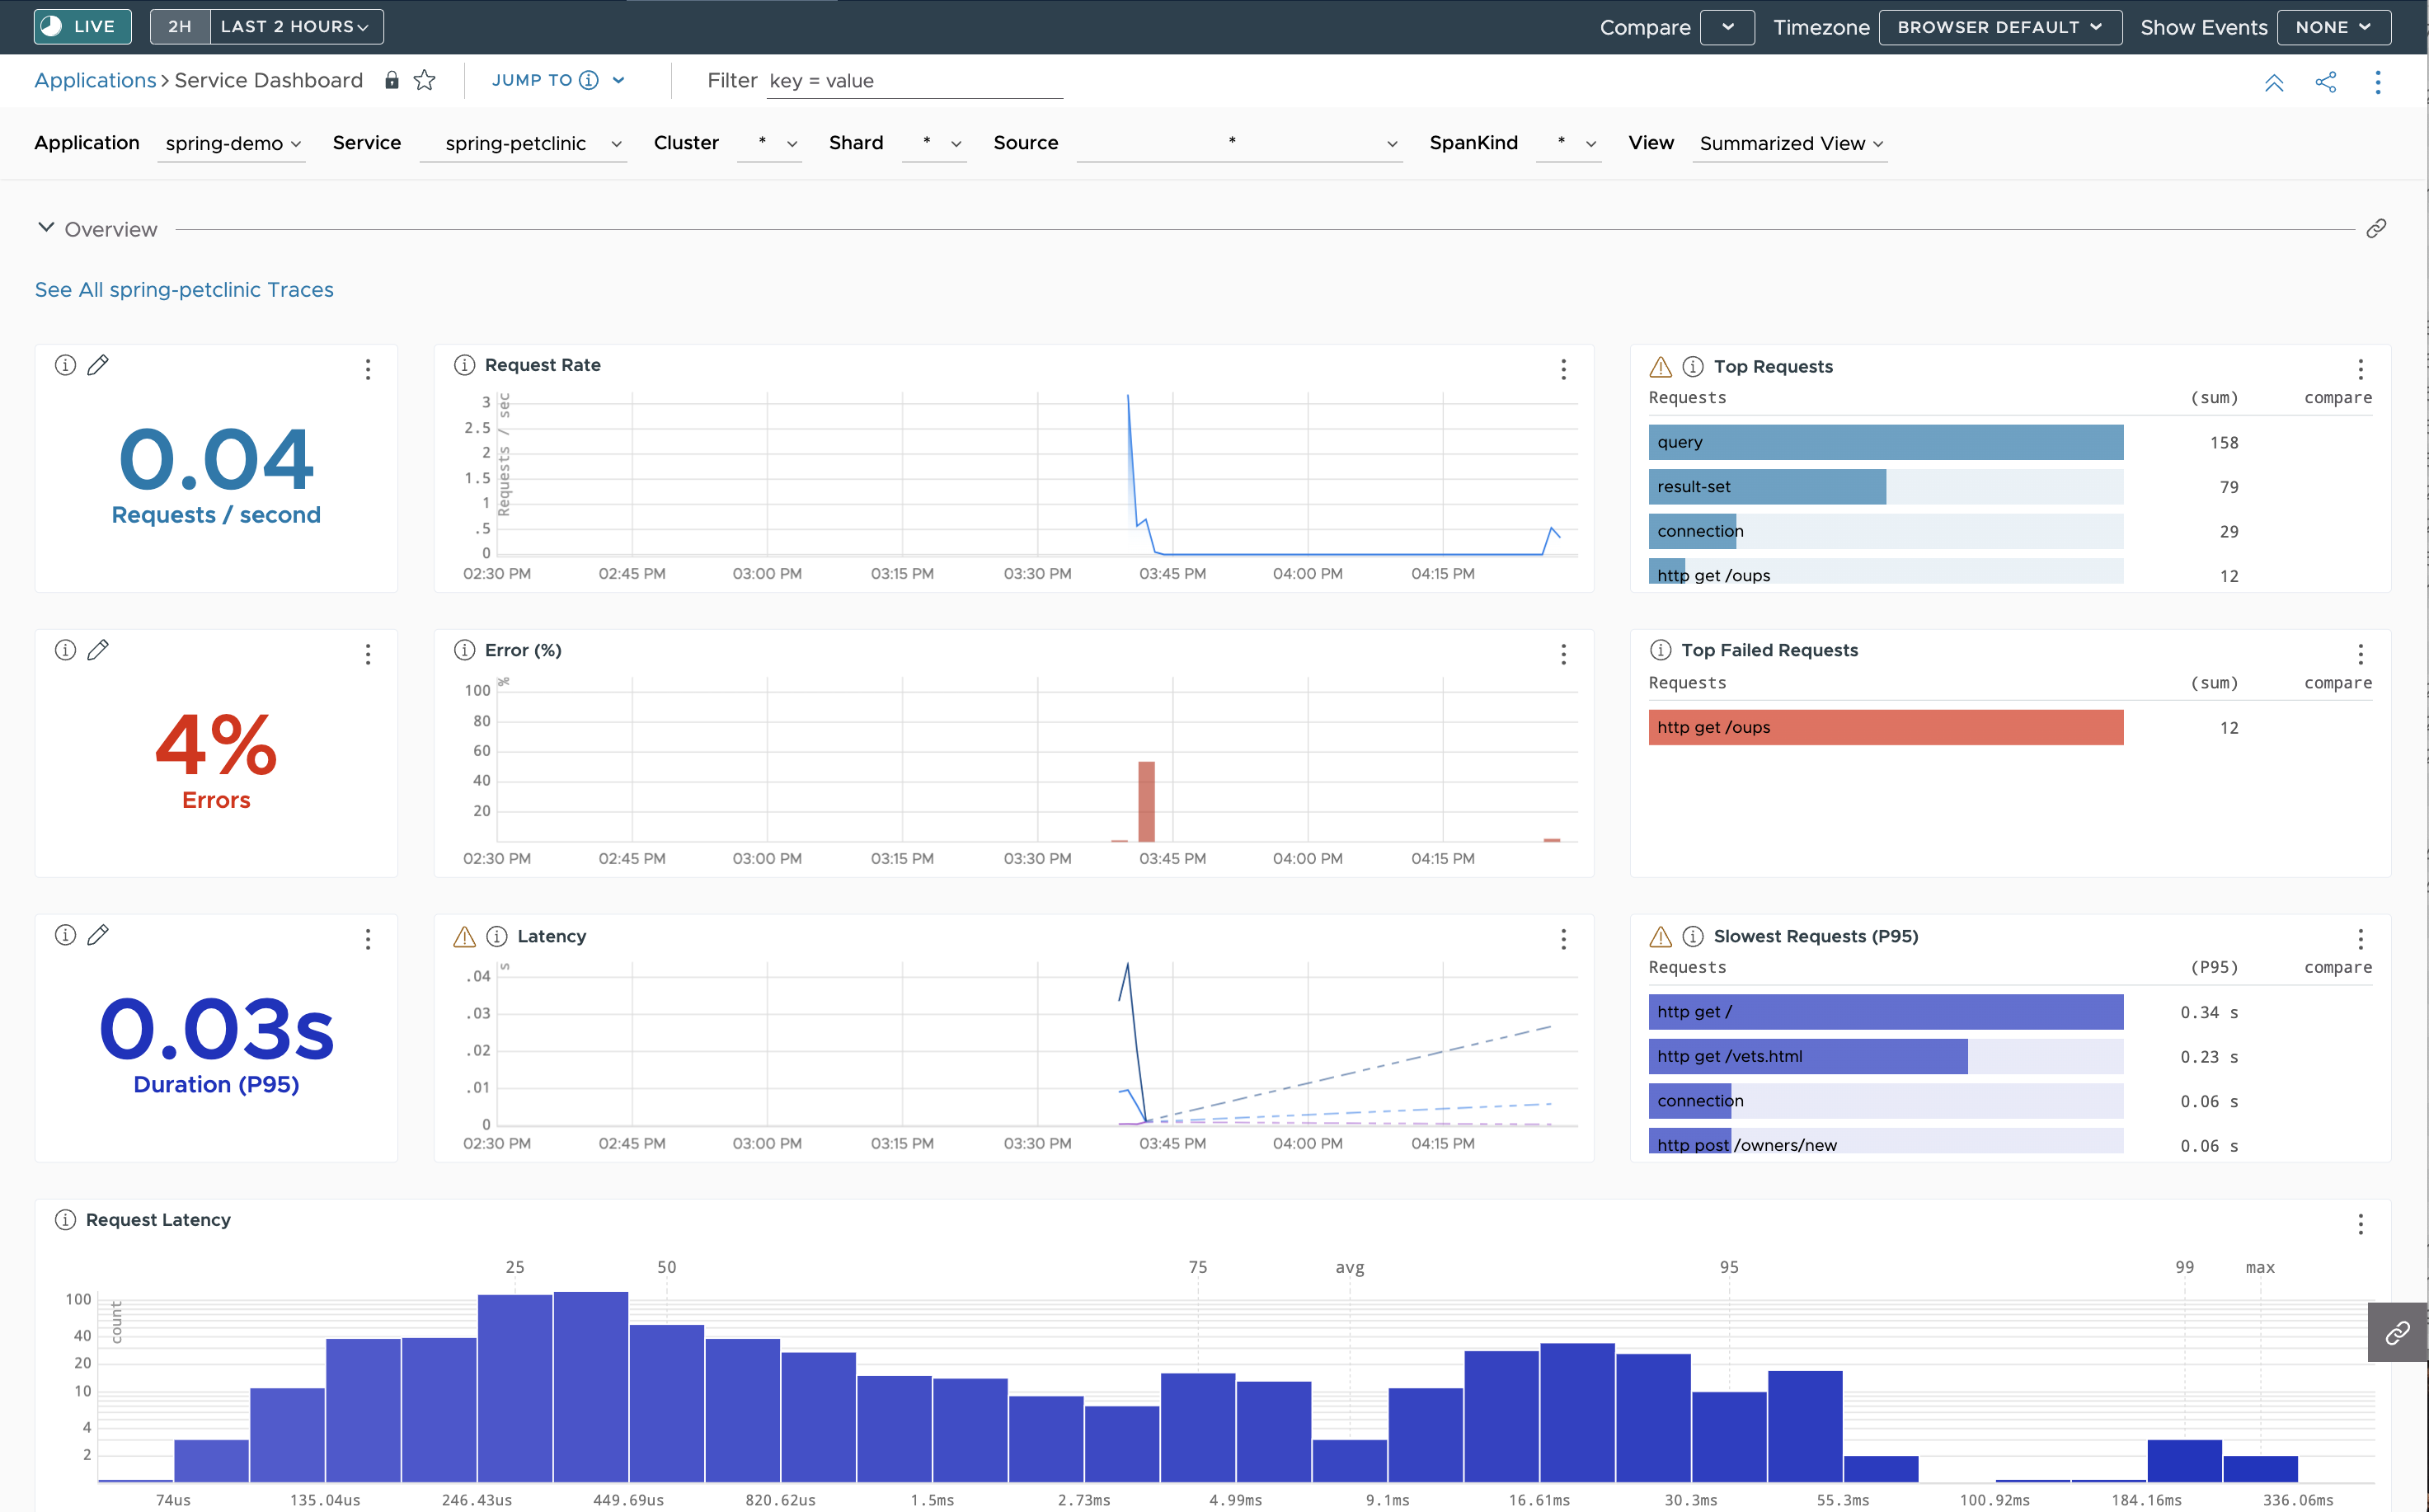
Next Steps
- See the Wavefront for Spring Boot FAQs.
- You cannot save changes that you make to the preconfigured Spring Boot Inventory and Wavefront for Spring Boot Service Dashboards. If you want to modify a preconfigured dashboard, you must clone and edit the preconfigured dashboard. For details, see Create and Customize Dashboards.
- Customers or free trial users can create smart alerts that dynamically filter noise and find true anomalies. For details, see Alerts.
Note: Alerts are not supported on the freemium cluster.
- Try out the petclinic application with the Micrometer. See Wavefront for Spring Boot: Getting Started for details.