In addition to setting up and using Tanzu Observability as a Wavefront Query Language data source in Grafana, you can also use Tanzu Observability as a Prometheus data source in Grafana.
When you set up Tanzu Observability as a data source in Grafana, you can view the data stored in Tanzu Observability by using the Grafana GUI.
Set Up Tanzu Observability as a Prometheus Data Source
To set up Tanzu Observability as a PromQL data source in Grafana, you must provide an API Token.
-
Log in to your Grafana instance.
-
In the Navigation bar on the left, click Configuration.
-
Click Add data source and under Time series databases click Prometheus.
-
In the Name text box, enter a meaningful name of the data source.
-
Under HTTP, in the URL text box, enter the URL of your product cluster:
https://<example>.wavefront.com.You can ignore or leave the other settings defaults in this section.
-
Under Auth make sure to turn the With Credentials option on.
-
Under Custom HTTP Headers set the following settings:
- In the Header text box, enter Authorization as the header name.
- In the Value text box, enter
Bearer <Your-API-Token>.
-
Click Save and Test.
How to Use Tanzu Observability as a Prometheus Data Source
To use Tanzu Observability as a PromQL data source, make sure that PromQL support is enabled on your cluster.
You can now test and see that a PromQL query in Tanzu Observability returns the same result as a PromQL query in Grafana when the data source is the Tanzu Observability cluster that you have configured.
-
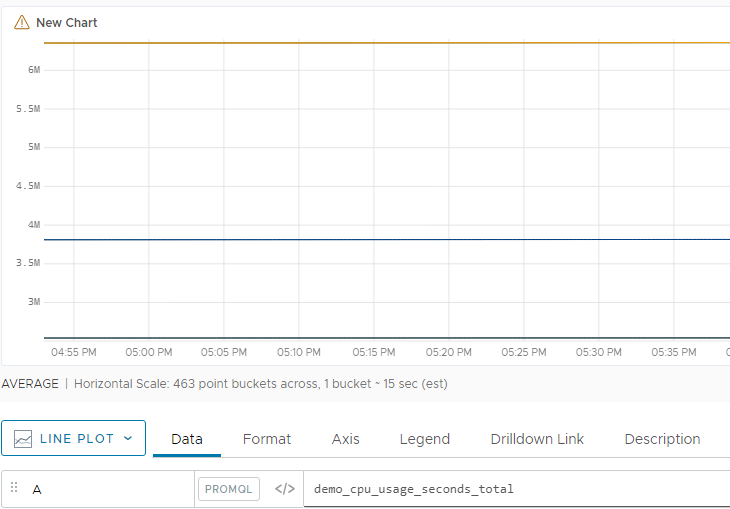
A PromQL query in Tanzu Observability:
-
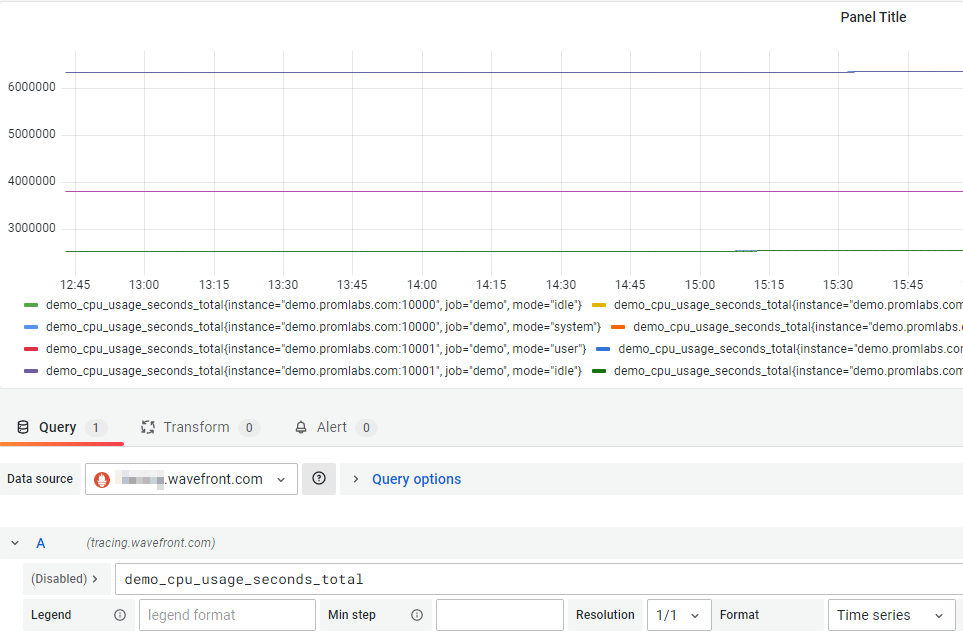
Same PromQL query in Grafana when the data source is the Tanzu Observability cluster that you have just set up.