A common way to collect and send metric data to VMware Tanzu Observability (formerly known as VMware Aria Operations for Applications) is through a Telegraf agent that is configured to relay the metrics to a Wavefront proxy. This doc page has some Telegraf troubleshooting and tuning information. See Proxy Troubleshooting for details on resolving proxy problems.
Connection Troubleshooting
If the Telegraf agent doesn’t send metrics to the proxy, the issue is typically network related, for example:
- DNS resolution failures.
- Invalid hostnames or IP addresses were configured for the proxy defined in the Telegraf configuration files.
- Firewalls across the network are blocking the communication to the configured port on the proxy.
- Connection reset by a load balancer causes
broken pipeerror.
Connection errors can look like this in the log:
Error writing to outputs.wavefront: Wavefront sending error: unable to connect to Wavefront proxy
Jan 27 15:14:52 hostname telegraf[22421]: 2021-01-27T22:14:52Z E! [agent] Error writing to outputs.wavefront: Wavefront sending error: unable to connect to Wavefront proxy at address: 10.10.100.100:2878, err: "dial tcp 10.10.100.100:2878: i/o timeout"

Jan 27 15:14:52 hostname telegraf[22421]: 2021-01-27T22:14:52Z E! [outputs.influxdb] When writing to [http://localhost:8086]: Post "http://localhost:8086/write?db=telegraf": dial tcp 127.0.0.1:8086: connect: connection refused
Step 1: Perform Initial Connectivity Check
- Troubleshoot the environment for connectivity issues between the Telegraf agent and the Wavefront proxy (nslookup, ping, telnet, packet capture etc.).
- In
telegraf.confconfirm that the hostname or IP address for the proxy is accurate.
Step 2: Look for Firewall-Related Issues
Intermittent broken pipe messages logged from telegraf are typically due to firewalls that are closing a socket connection, as in the following example:
telegraf[xxx]: 2021-03-03T09:25:19Z E! [agent] Error writing to outputs.wavefront: Wavefront sending error: write tcp 192.168.xxx.xxx:36948->192.168.xxx.xx:2878: write: broken pipe
telegraf[xxx]: 2021-03-03T09:26:10Z I! connected to Wavefront proxy at address: 192.168.xxx.xx:2878
To Resolve Firewall-Related Issues:
Enabling the Wavefront output plugin to use the HTTP protocol instead of the socket connection might be necessary. Resolve Connection Errors in Environments with Load Balancers explain how to do this.
Step 3: Resolve Connection Errors in Environments with Load Balancers
If you’re sending metrics from a Telegraf agent through a load balancer to a Wavefront proxy, you might see broken connection messages in the logs. This messages can appear, for example, if metrics come from an AWS EC2 instance and pass through AWS ELB to a Wavefront proxy over a socket connection.
telegraf[xxx]: 2021-03-03T09:25:19Z E! [agent] Error writing to outputs.wavefront: Wavefront sending error: write tcp 192.168.xxx.xxx:36948->192.168.xxx.xx:2878: write: broken pipe
telegraf[xxx]: 2020-03-03T09:26:10Z I! connected to Wavefront proxy at address: 192.168.xxx.xx:2878
Cause
When the Wavefront output plugin is communicating over a socket connection, it assumes a stable connection between the Telegraf agent and the Wavefront proxy. If, for example, a load balancer resets the connection after a set period of time (such as 60 seconds), the stable connection requirement is not satisfied.
Workaround 1: Use HTTP
Use the HTTP protocol instead of the socket connection. HTTP doesn’t require a stable connection.
To change the output plugin to use HTTP mode, specify url:port in the output.wavefront Telegraf plugin.
For example:
[[outputs.wavefront]]
  url = "http://192.168.xxx.xxx:2878"
  metric_separator = "."
  source_override = ["hostname", "agent_host", "node_host"]
  convert_paths = true
See the Wavefront Output Plugin on Github for background.
Workaround 2: Increase Load Balancer Timeout Value
Instead of using HTTP, you can increase the load balancer idle connection timeout value, for example to 120 seconds. How that works depends on the load balancer that you are using.
Telegraf Agent Troubleshooting
If you suspect issues with the collection and sending of metrics from a Telegraf agent to the Wavefront proxy, you can start with the troubleshooting step in this section.
Step 1: Verify Plugins
Check that the intended input plugins are enabled and that Telegraf is able to collect their metrics.
- Run the
telegraf --testcommand, as shown in the following example. - Investigate startup errors related to misconfigured plugins, file permissions etc. based on the information that is returned. (In the example below, we’ve shortened the return values for improved legibility.)
>telegraf --test
  2021-11-08T15:58:24Z I! Starting Telegraf 1.19.0
  2021-11-08T15:58:24Z I! Using config file: /etc/telegraf/telegraf.conf
> net,host=centos-2021,interface=virbr0
  bytes_recv=0i,bytes_sent=0i,drop_in=0i,drop_out=0i,err_in=0i,err_out=0i,packets_recv=0i,packets_sent=0i 1636387105000000000
> net,host=centos-2021,interface=ens33
  bytes_recv=235865896i,bytes_sent=13420041i,drop_in=0i,drop_out=0i,err_in=0i,err_out=0i,packets_recv=169362i,packets_sent=23833i 1636387105000000000
> net,host=centos-2021,interface=all
  icmp_inaddrmaskreps=0i,icmp_inaddrmasks=0i,icmp_incsumerrors=0i,icmp_indestunreachs=92i,icmp_inechoreps=0i,icmp_inechos=1i,icmp_inerrors=34i,icmp_inmsgs=93i,icmp_inparmprobs=0i,...
Step 2: Validate Plugin Configuration
Validate that the Telegraf input plugins are correctly configured. Examine the log output. See the documentation on GitHub for the input and output plugin that you’re using.
Step 3: Check for Metric Exclusions in telegraf.conf
If a small amount of metrics from a particular plugin is missing, check that the plugin is not configured to exclude those metrics. For example, in the vSphere input plugin configuration in the telegraf.conf file shown below, virtual machine and host metrics are excluded on purpose. By default, the telegraf.conf file is located in /etc/telegraf/telegraf.conf.
# Read metrics from one or many vCenters
[[inputs.vsphere]]
vm_metric_exclude = ["cpu.idle.summation","cpu.readiness.average","cpu.ready.summation","cpu.run.summation"]
host_metric_exclude =["cpu.idle.summation","cpu.readiness.average","cpu.ready.summation","cpu.wait.summation"]
Step 4: Customize the Log File
The Linux Telegraf agent does not log to /var/log/telegraf.log by default, but to syslog (/var/log/syslog or equivalent depending on the OS distribution).
To customize the log file:
- Uncomment the log file line in
telegraf.confto send Telegraf log information to its own log file. - To increase verbosity, enable debug mode.
Here’s an example of a customized telegraf.conf file:
## Name of the file to be logged to when using the "file" log target. If set to
## the empty string then logs are written to stderr.
logfile = "/var/log/telegraf/telegraf.log"

## Run telegraf in debug mode
debug = false
## Run telegraf in quiet mode
quiet = false
Step 5: Find Data Format Issues
If you don’t see issues in the Telegraf logs, ensure that the data are in a format the proxy supports. Recent versions of the proxy log any issues with the metric data quality indicate data format issues.
Check the proxy log for reject errors. The file is at /var/log/wavefront/wavefront.log on the proxy machine by default. You might see an error message like the following:
021-11-08 15:32:24,337 INFO [AbstractReportableEntityHandler:reject] [2878] blocked input: [WF-300 Cannot parse metric: "Update" source="rules-service"
Step 6: Verify Data on Local Drive
If the plugins appear to be working as expected but you don’t see the metrics, set up Telegraf to temporarily send data to the local drive. You can then verify that the data is being captured and that it is in the expected format.
Here’s an example telegraf.conf file.
[[outputs.file]]
## Files to write to, "stdout" is a specially handled file.
  files = ["stdout", "/tmp/metrics.out"]
In the example, the file /tmp/metrics.out contains all data sent from Telegraf to the proxy. Examine the file to confirm the Telegraf input plugins are gathering the metric data with appropriate tagging.
Not all errors in the logs may be actionable, and not all plugins may be required, for example the error message below is not a proxy related error. For example, you might see messages like this:
Jan 27 15:14:22 hostname telegraf[22421]: 2021-01-27T22:14:22Z E! [outputs.influxdb] When writing to [http://localhost:8086]: Post "http://localhost:8086/write?db=telegraf": dial tcp 127.0.0.1:8086: connect: connection refused
Jan 27 15:14:22 hostname telegraf[22421]: 2021-01-27T22:14:22Z E! [agent] Error writing to outputs.influxdb: could not write any address
If you don’t want to see the error and if you don’t need the outputs.influxdb plugin, you can disable the outputs.influxdb plugin:
- Comment out (#) the
outputs.influxdbplugin lines in thetelegraf.conffile. - Restart the Telegraf agent.
Telegraf Agent Tuning
When you send metrics from a Telegraf agent, either directly or through a Wavefront proxy, you can fine tune the agent to remove bottlenecks and to ensure all metrics are delivered in a timely manner.
Examine Telegraf Log Messages
Messages in the Telegraf logs might indicate which of the default settings need adjustment to handle all the metrics that are sent.
-
Metrics dropped: The following message indicates that the buffer has been dropping metrics because the buffer isn’t big enough to handle the number of metrics collected.
To resolve this issue, you can increase the
metric_buffer_limit.May 17 19:17:00 test-server1 telegraf[1562]: 2021-05-17T15:27:00Z W! [outputs.wavefront] Metric buffer overflow; 1956 metrics have been dropped -
Metric batch size to large: The following message indicates that the metric_batch_size is too large to be flushed within the configured flush interval.
To resolve this issue, adjust the flush interval.
May 17 11:02:56 test-server2 telegraf[1468]: 2021-05-17T11:02:56Z W! [agent] ["outputs.wavefront"] did not complete within its flush interval
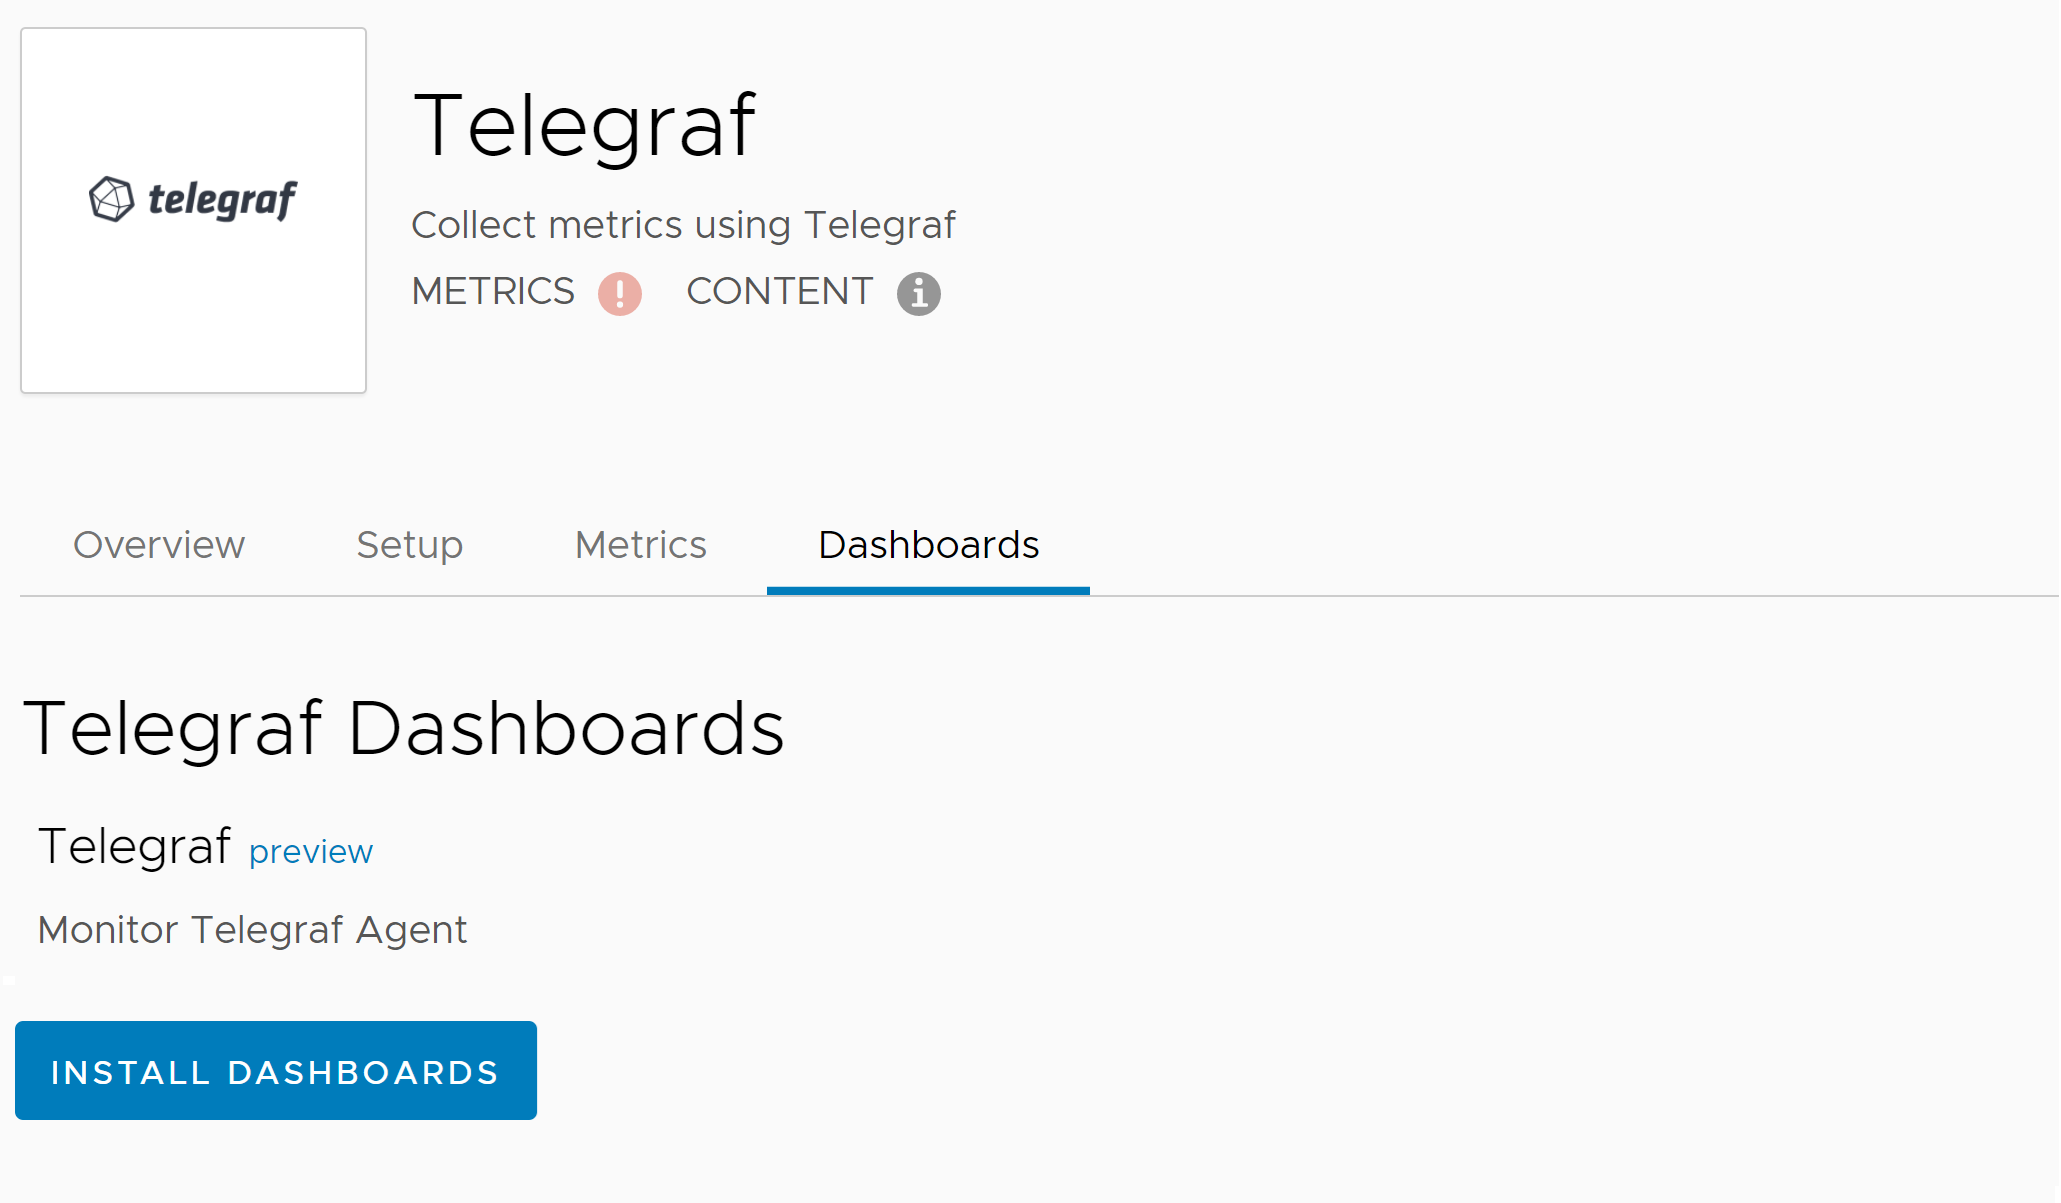
Enable Agent Metrics Collection in the Telegraf Integration Dashboard
Set up the Telegraf integration to collect metrics for Telegraf agent performance.
- Create a
telegraf.conffile in/etc/telegraf/telegraf.d. - Add the following snippet
# Collect internal Telegraf statistics [[inputs.internal]] ## If true, collect Telegraf memory stats. collect_memstats = true name_prefix = "telegraf." - Restart the Telegraf agent.
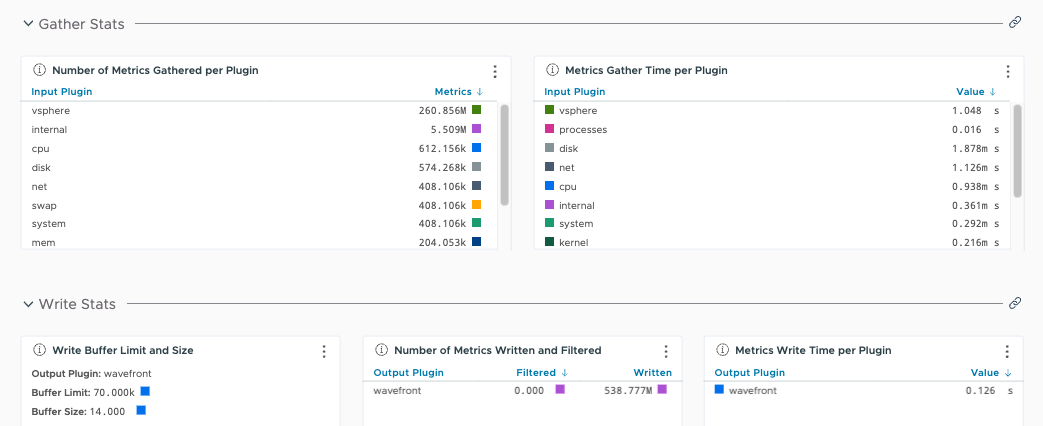
Examine Data in Dashboards and Charts
After you’ve enabled agent metrics collection, you can examine Telegraf statistics:
In the GUI, find the integration.
|
 |
Select and explore the dashboard.
|
 |
Clone the Default Dashboard and Customize Charts
To drill down even more, you can clone the Telegraf dashboard and add charts with custom queries in Wavefront Query Language (WQL).
For example:
-
Use queries. The following example query shows the rate of metrics collected for vSphere:
rate(ts("telegraf.internal_gather.metrics_gathered", input="vsphere")) * 60 -
Plot the internal metrics collected from the Telegraf agent on a chart to show trends and visualize areas that might need adjustment. The following example chart plots the buffer size, buffer limit, and rate of dropped metrics.
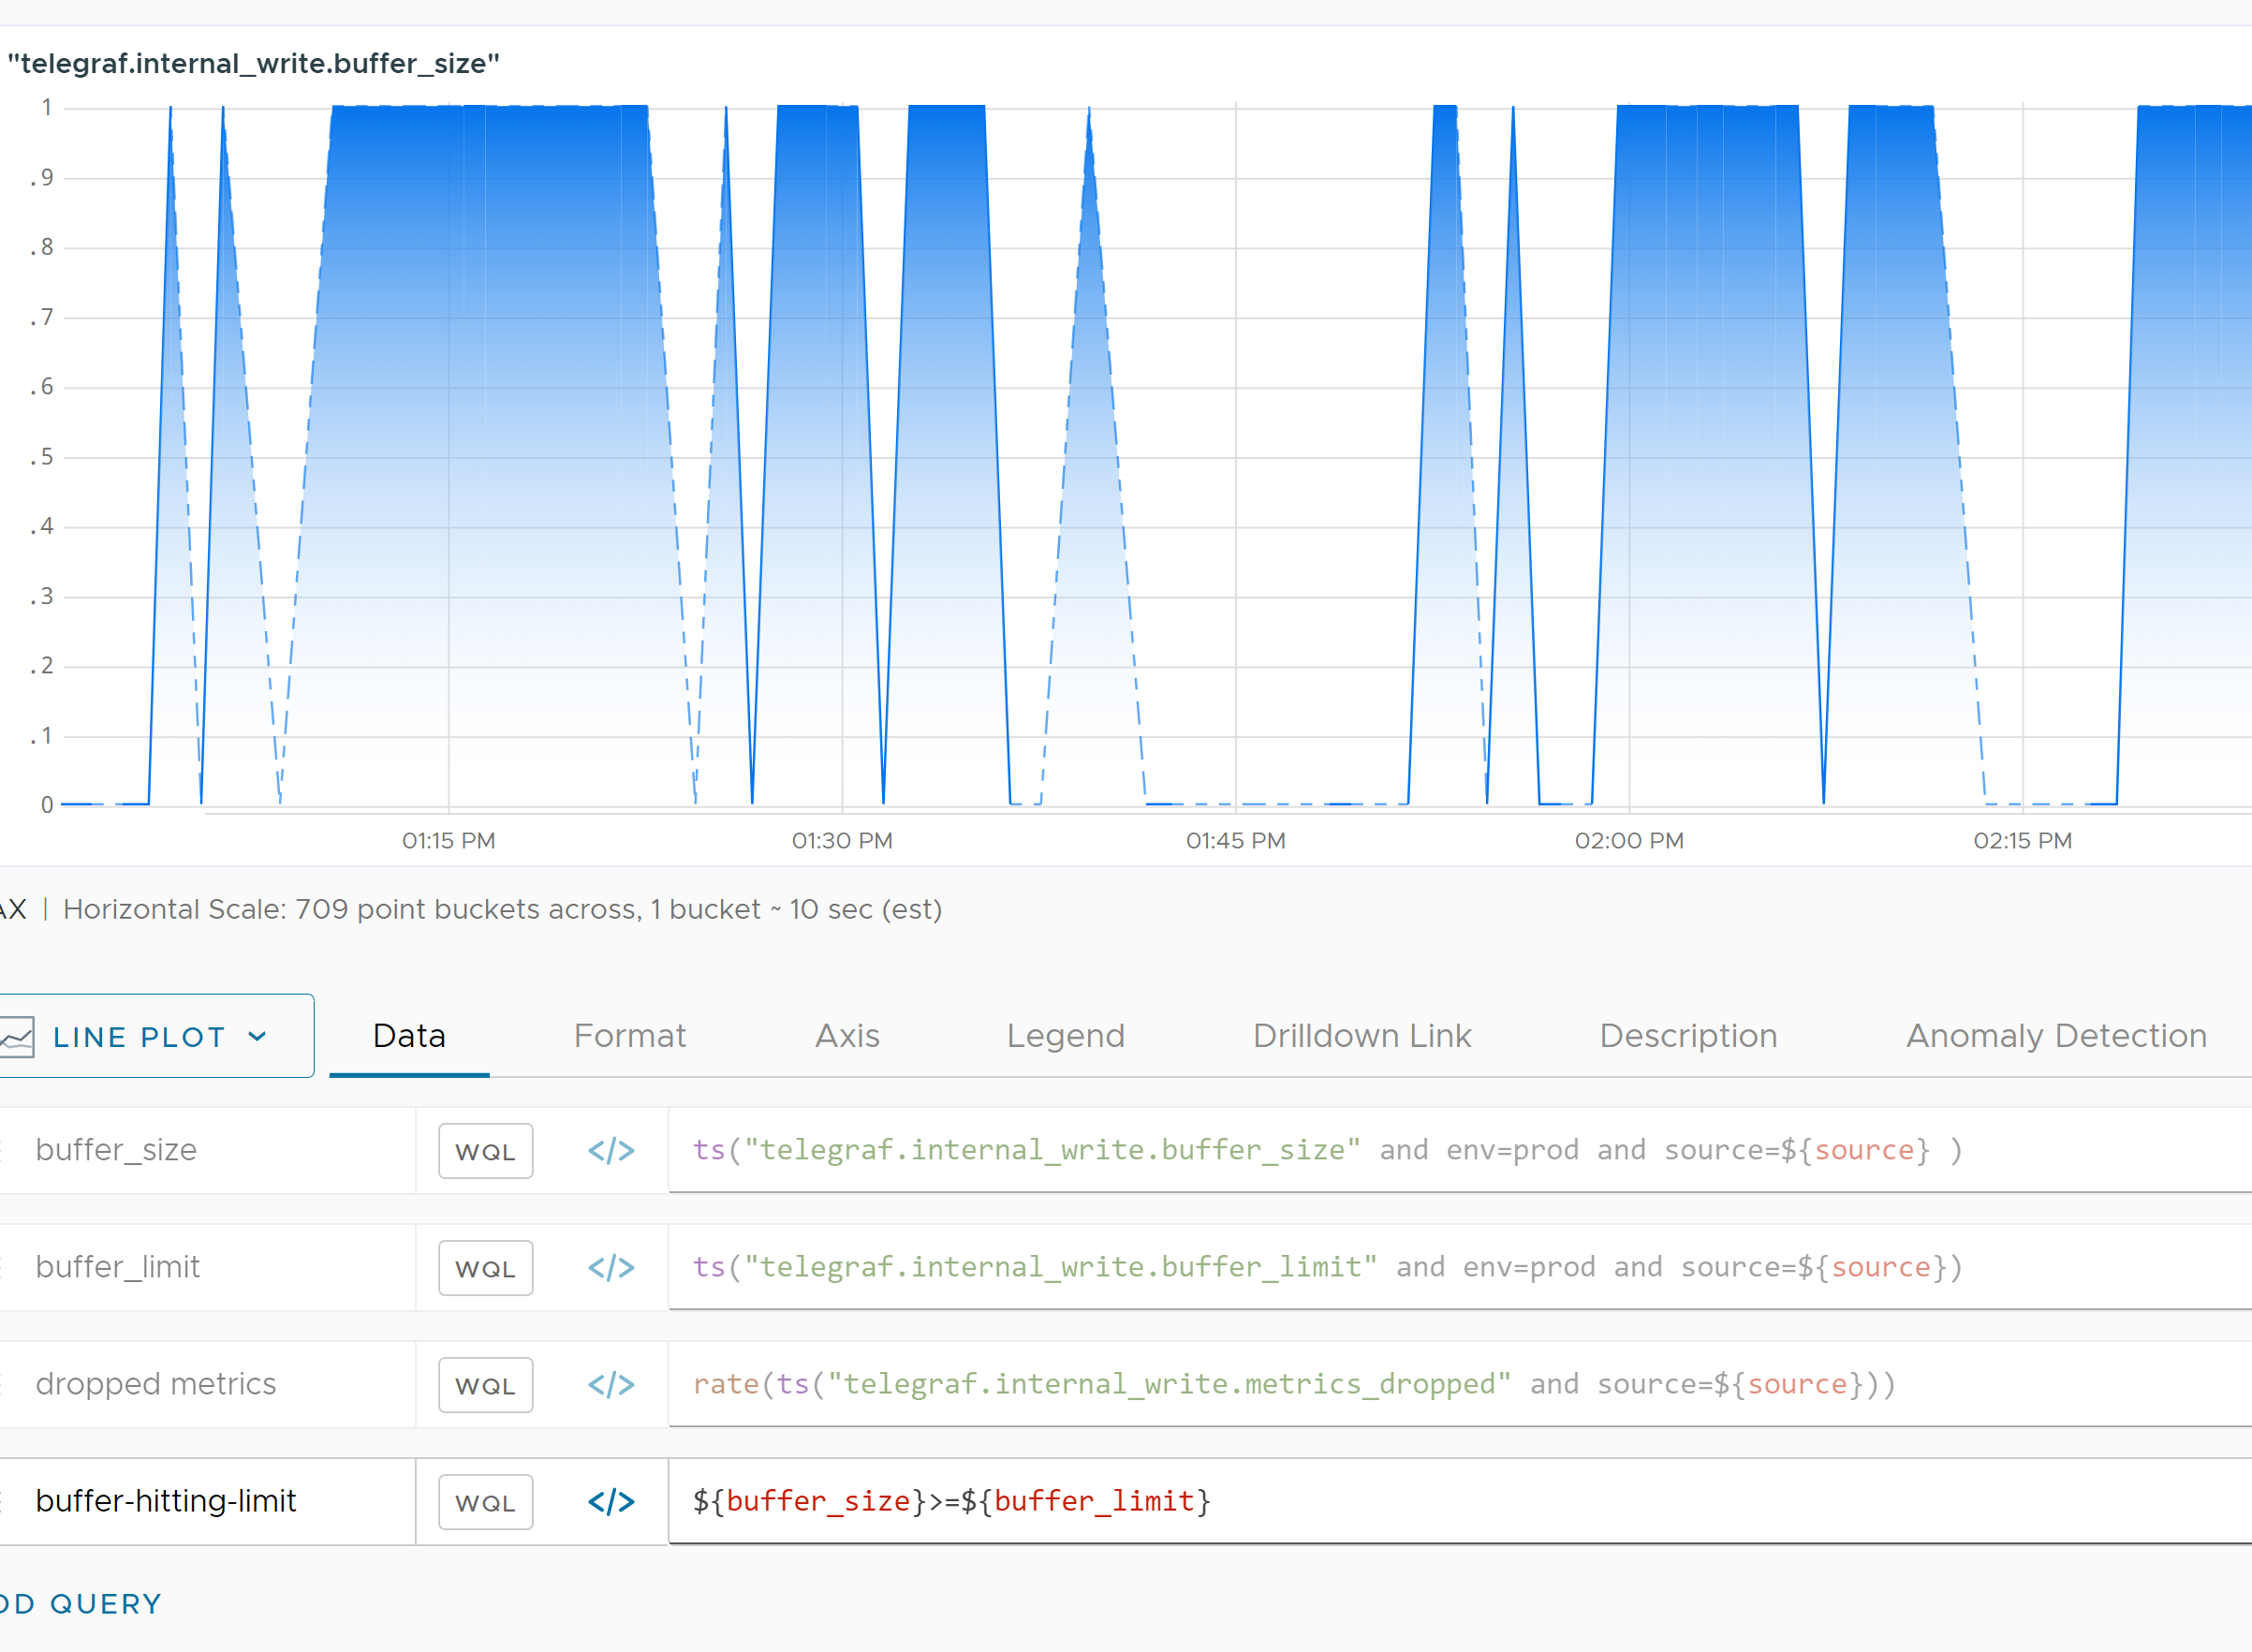
The chart shows us that the Telegraf agent buffer size is hitting the buffer limit. Metrics are being dropped as a result.
Fine-Tune Default Settings
The default settings for the input and output plugins are in the telegraf.conf file, which is in the following locations by default:
- Windows:
Program Files\Telegraf\telegraf.conf - Linux:
/etc/telegraf/telegraf.conf
The following parameters might need adjustment:
| interval | The default data collection interval for all inputs used by Telegraf. This setting specifies how frequently metric data are collected. |
| flush interval | Specifies how frequently to flush the collected metric data to the output plugin. |
| metric_batch_size | Size of the number of metrics that will be written to the output plugin at once. |
| metric_buffer_limit | If the inputs collected exceed this buffer limit, then all the overflow data are dropped and discarded. The metric buffer needs to be large enough for the data collection interval. |
Telegraf Upgrades
Keep both Wavefront proxies and Telegraf agents updated to benefit from security fixes and other improvements. See the Wavefront Proxy Obsolescence information for proxy obsolescense details.
Follow these steps:
- Upgrade the proxy to the latest available version.
- See Upgrade a Proxy for the process.
- See the Proxy Release Notes on Github for recent new features.
- Upgrade the Telegraf agent by downloading the binaries through https://portal.influxdata.com/downloads/. Installation packages for Linux are also available at https://packagecloud.io/wavefront/telegraf.
See Also
- Proxy Log Messages
- Installing Telegraf Manually
- Telegraf on Github