Summary
bottom(<numberOfTimeSeries>, [mean|median|min|max|sum|count, [<timeWindow>,]] <tsExpression>)
Ranks the time series described by the expression, and returns 1 for the specified number of bottom-ranked series, and 0 for the other series. Ranking for a time series is based on its last data value in the current chart, or on a summarization of its last data values over a specified time window.
Parameters
| Property | Description |
|---|---|
| numberOfTimeSeries | Number of bottom-ranked time series to be returned as 1. |
| mean|median|min|max|sum|count | Summarization method to use for combining data values in a time series. These are similar to the Summarize by options that you can set for a chart. Default is to rank each series according to the value of its last (rightmost) data point on the current chart, if this parameter is not specified. |
| timeWindow | Length of the time window over which to summarize data values in a time series, if a summarization method is specified. You can specify a time measurement based on the clock or calendar (1s, 1m, 1h, 1d, 1w), the window length (1vw) of the chart, or the bucket size (1bw) of the chart. Default is 1vw, if this parameter is not specified. |
| tsExpression | Expression that describes the time series to be ranked and filtered. |
Description
The bottom() function ranks the time series described by the expression, and then uses that ranking to represent each time series as either the constant 1 or the constant 0:
- 1 is returned for each time series that is in the specified number of series at the bottom of the ranking.
- 0 is returned for each of the remaining time series.
The returned constants are continuous time series.
About Ranking
Depending on the parameters you specify, the time series are ranked from top to bottom based one or more data values in each series:
-
By default, the ranking is based on the value of the latest (rightmost) single data point displayed for each series on the current chart. When a chart shows live data, each series is therefore ranked according to its most recently reported value. The series with the lowest rightmost value has the bottom ranking.
-
If you specify a summarization method (
mean,median,sum, etc.), the ranking is based on a summary value obtained from each series by combining one or more of its rightmost data values. For example,meanproduces a summary value for a series by averaging data values, and the series with the lowest average has the bottom ranking.- By default, the summary value for a series combines all of the values shown for the series in the current chart.
- If you specify a time window parameter, the summary value combines just the data values reported during that time window. The time window always includes the last (rightmost) data value in the chart. For example, in a live data chart, a time window of
2hsays to summarize the data values reported in the past 2 hours.
Parameter Usage Overview
The following table shows how the parameters of bottom() affect the results.
| Sample Parameters | Basis for Ranking Each Time Series | Sample Results |
|---|---|---|
bottom(3, ts(my.metric)) |
Value of the rightmost data point displayed for the series on the chart. | Returns 1 for each of the 3 time series with the lowest data values at the right edge of the chart. Returns 0 for all other series. |
bottom(3, min, ts(my.metric)) |
Summary value obtained from the data points reported by the series during the chart's time window. | Returns 1 for each of the 3 time series that had the lowest minimum data values during the chart's time window. Returns 0 for all other series. |
bottom(3, min, 2h, ts(my.metric)) |
Summary value obtained from the data points reported by the series during the specified time window. | Returns 1 for each of the 3 time series that had the lowest minimum data values during the last 2 hours before the end of the chart. Returns 0 for all other series. |
Examples
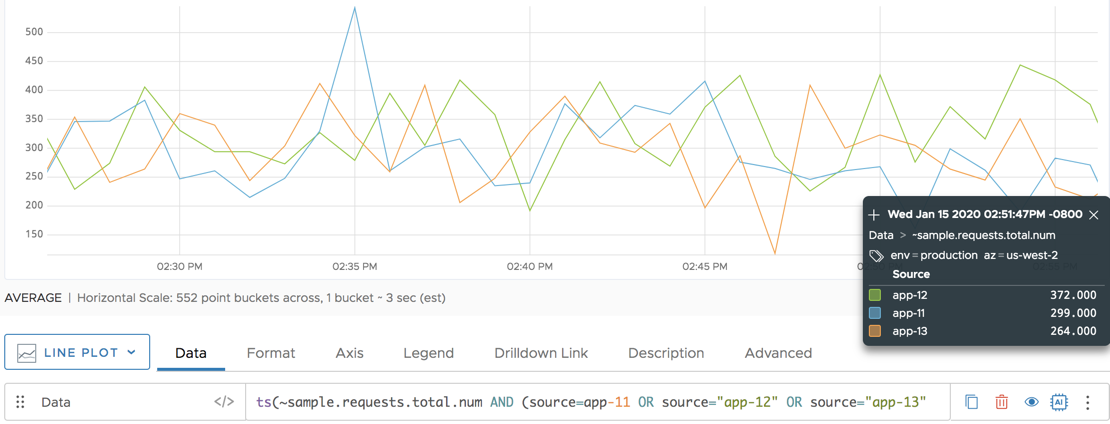
Unfiltered Series
This chart shows 3 time series that report the total number of requests from 3 sources. We will filter these series in the following examples.
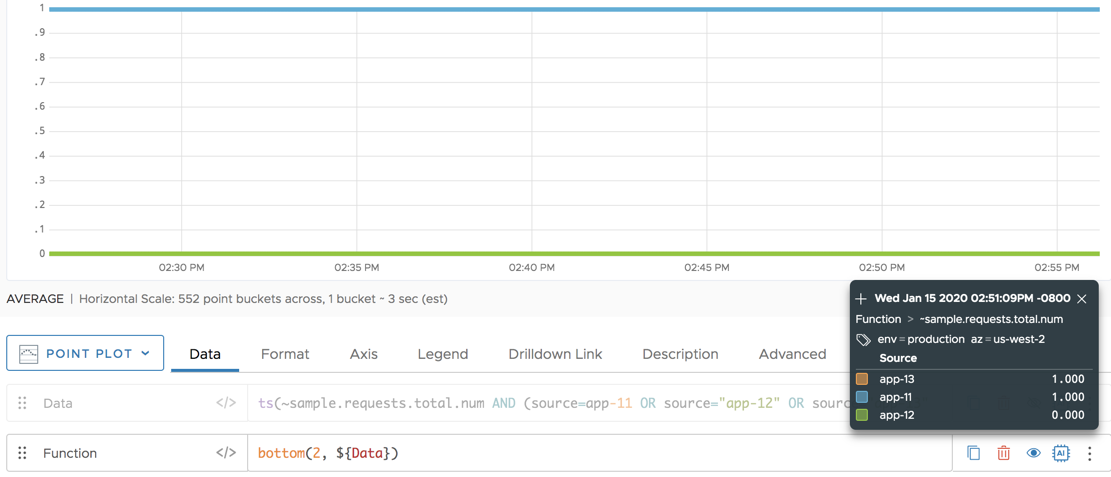
Example 1: Ranking by Rightmost Data Value
Here we use bottom() to filter the time series into two groups (1 or 0). The bottom 2 series (from sources app-12 and app-11) display as 1, and the remaining series displays as 0. The ranking is based on the value of the rightmost data point shown for each series in the chart:
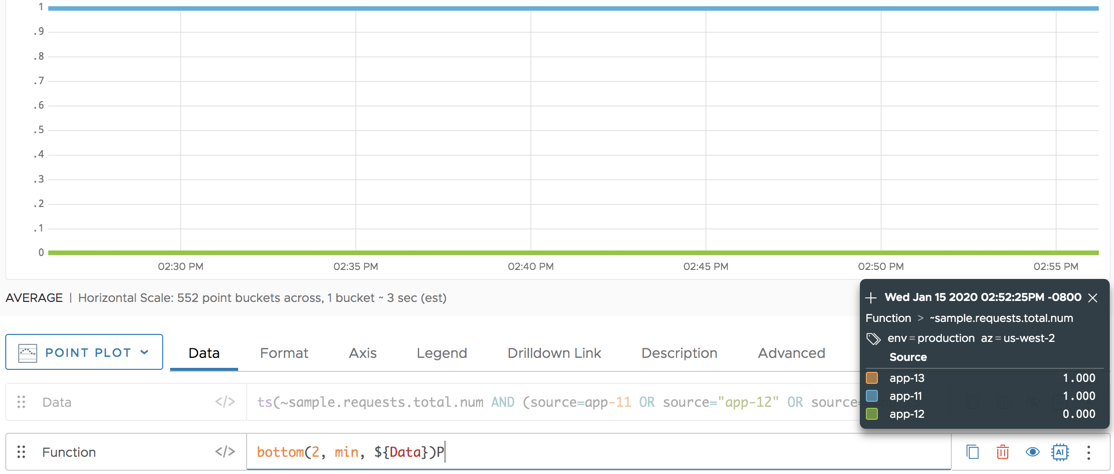
Example 2: Ranking by Summarized Data Values
Here we use bottom() with the summarization method min to filter the time series into two groups (1 or 0). The bottom 2 series (from sources app-12 and app-11) display as 1, and the remaining series displays as 0. The bottom two series had the two lowest values across the entire chart. The results might change if you change the chart’s time window.
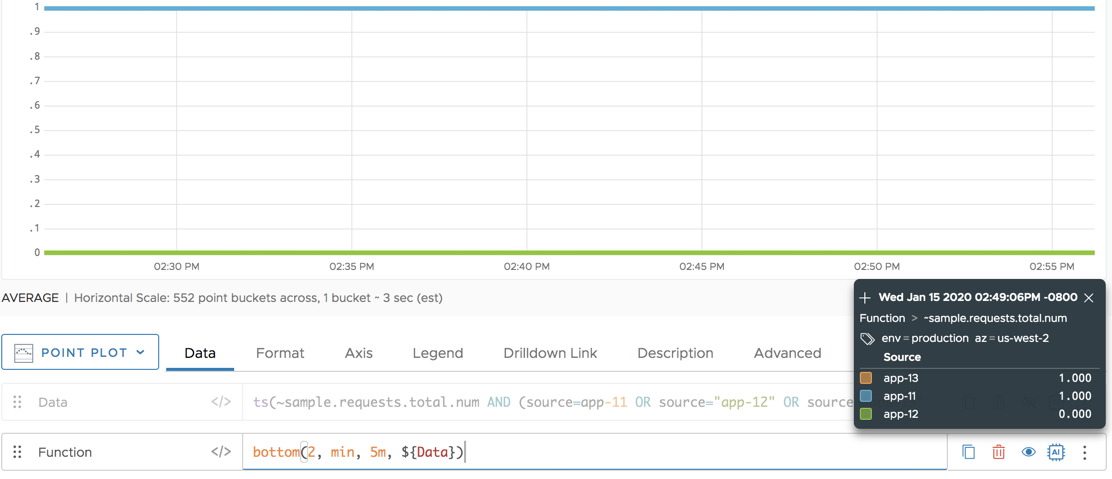
Example 3: Ranking by Data Values Summarized Over a Shorter Time Window
Here we use bottom() with the min summarization method over the final 5 minutes of the chart. In contrast to Example 2, the bottom 2 time series are now from sources app-12 and app-13. The lowest values within the 5 minute time window differ from the lowest values across the entire chart.