You can auto-discover and monitor your applications that run on a Kubernetes cluster or monitor your applications and services through the traces and spans sent to our service.
Select How You Send Data
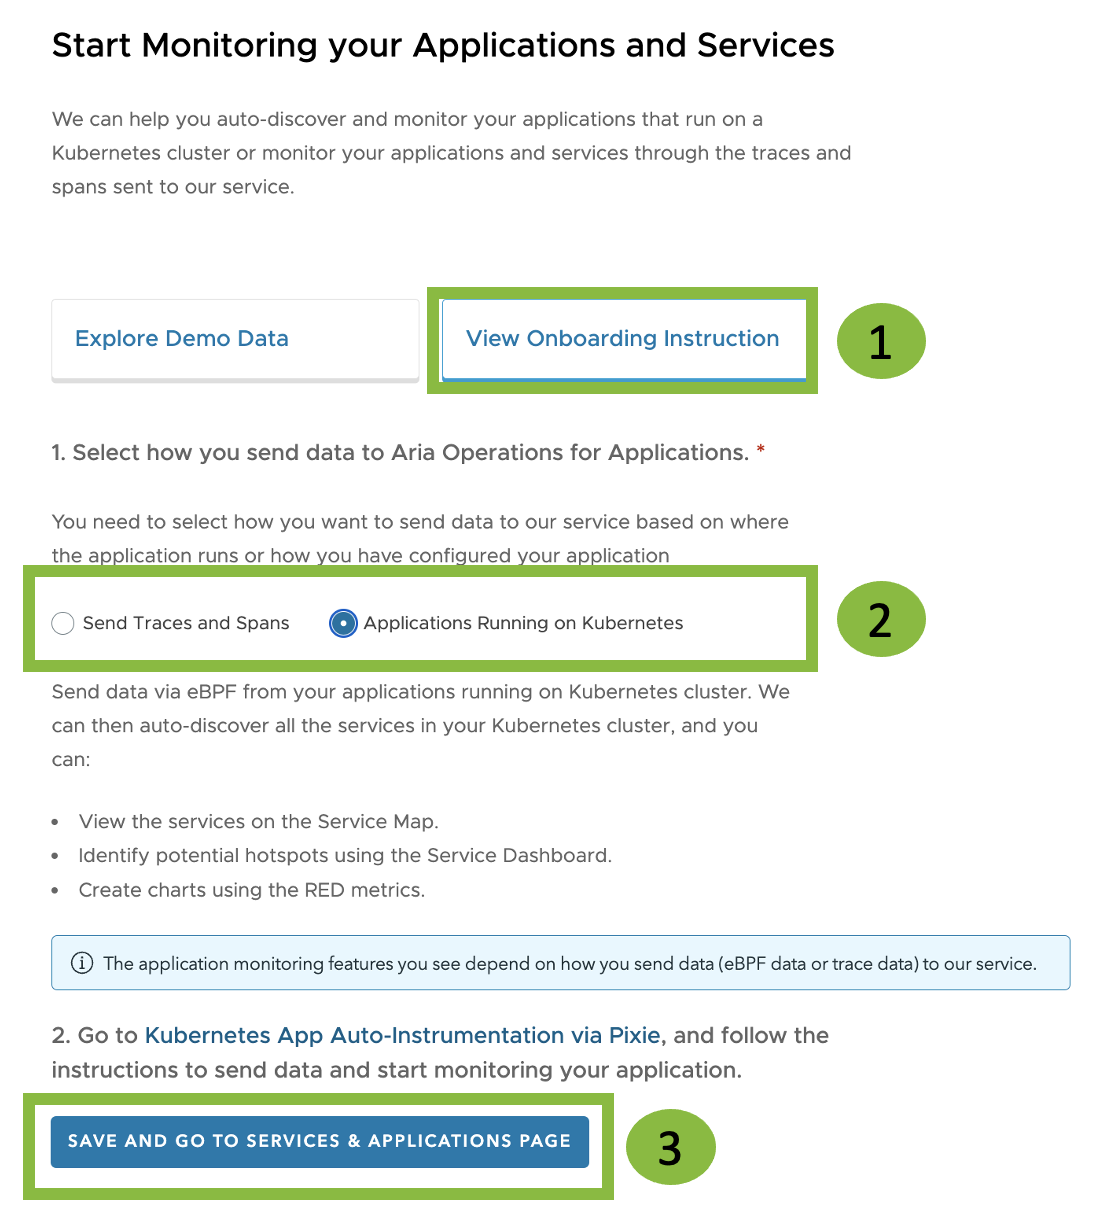
You can explore the demo data and drill down to the service map, and other dashboards. Then, you must select how you want to send data to our service based on where the application runs or how you have configured your application. Follow these steps:
|
|
Monitor Applications Running on Kubernetes
Send data via eBPF from your applications running on Kubernetes. We can then auto-discover all the services in your Kubernetes cluster.
Go to Kubernetes App Auto-Instrumentation via Pixie, and follow the instructions to send data and start monitoring your applications.
You can use the different dashboards and monitor your applications. You can:
- View the services on the Services and Applications page.
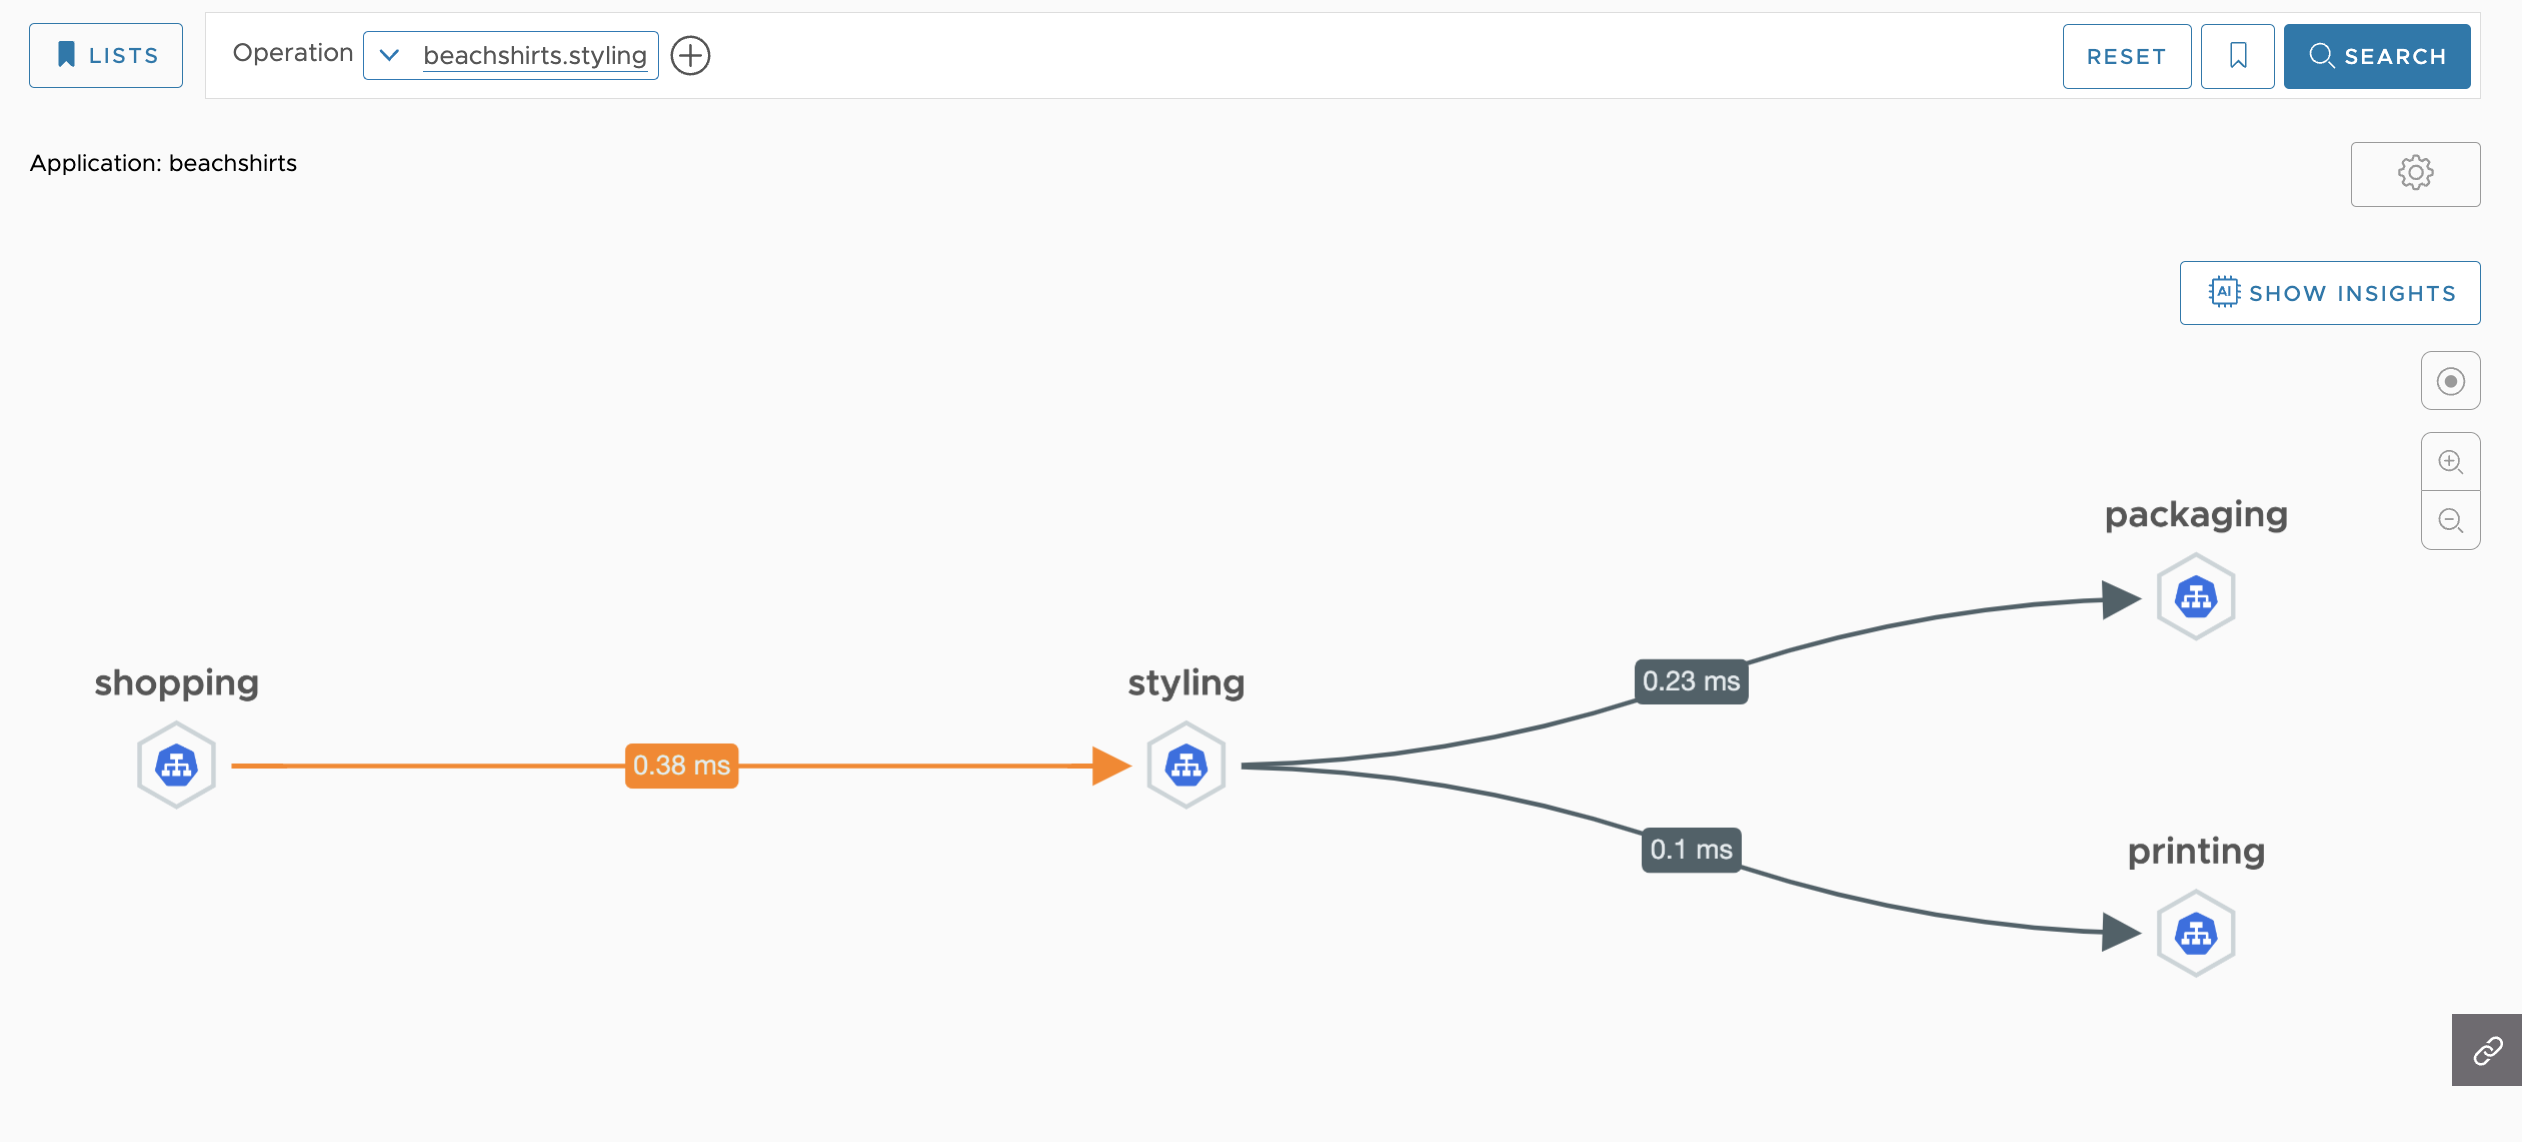
- See how a specific service communicates with the other services using the Service Map.
- Identify potential hotspots using the Service Dashboard.
- Create charts using the RED metrics.
Example: See how a specific service communicates with other services in the application on the service map.
Monitor Applications Using OpenTelemetry
Instrument your applications that use OpenTelemetry and send traces and spans to our service.
- Get an overview of how to configure your applications that use OpenTelemetry and send data to our service.
- The Java tutorial shows you how to auto-instrument your Java application using the OpenTelemetry Java agent and send data to our service.
Once the data is in our service, you can monitor your applications and visualize the data. You can:
- View the services on the Services and Applications page.
- See how a specific service communicates with the other services using the Service Map.
- Identify potential hotspots using the Service Dashboard.
- Create charts using the RED metrics.
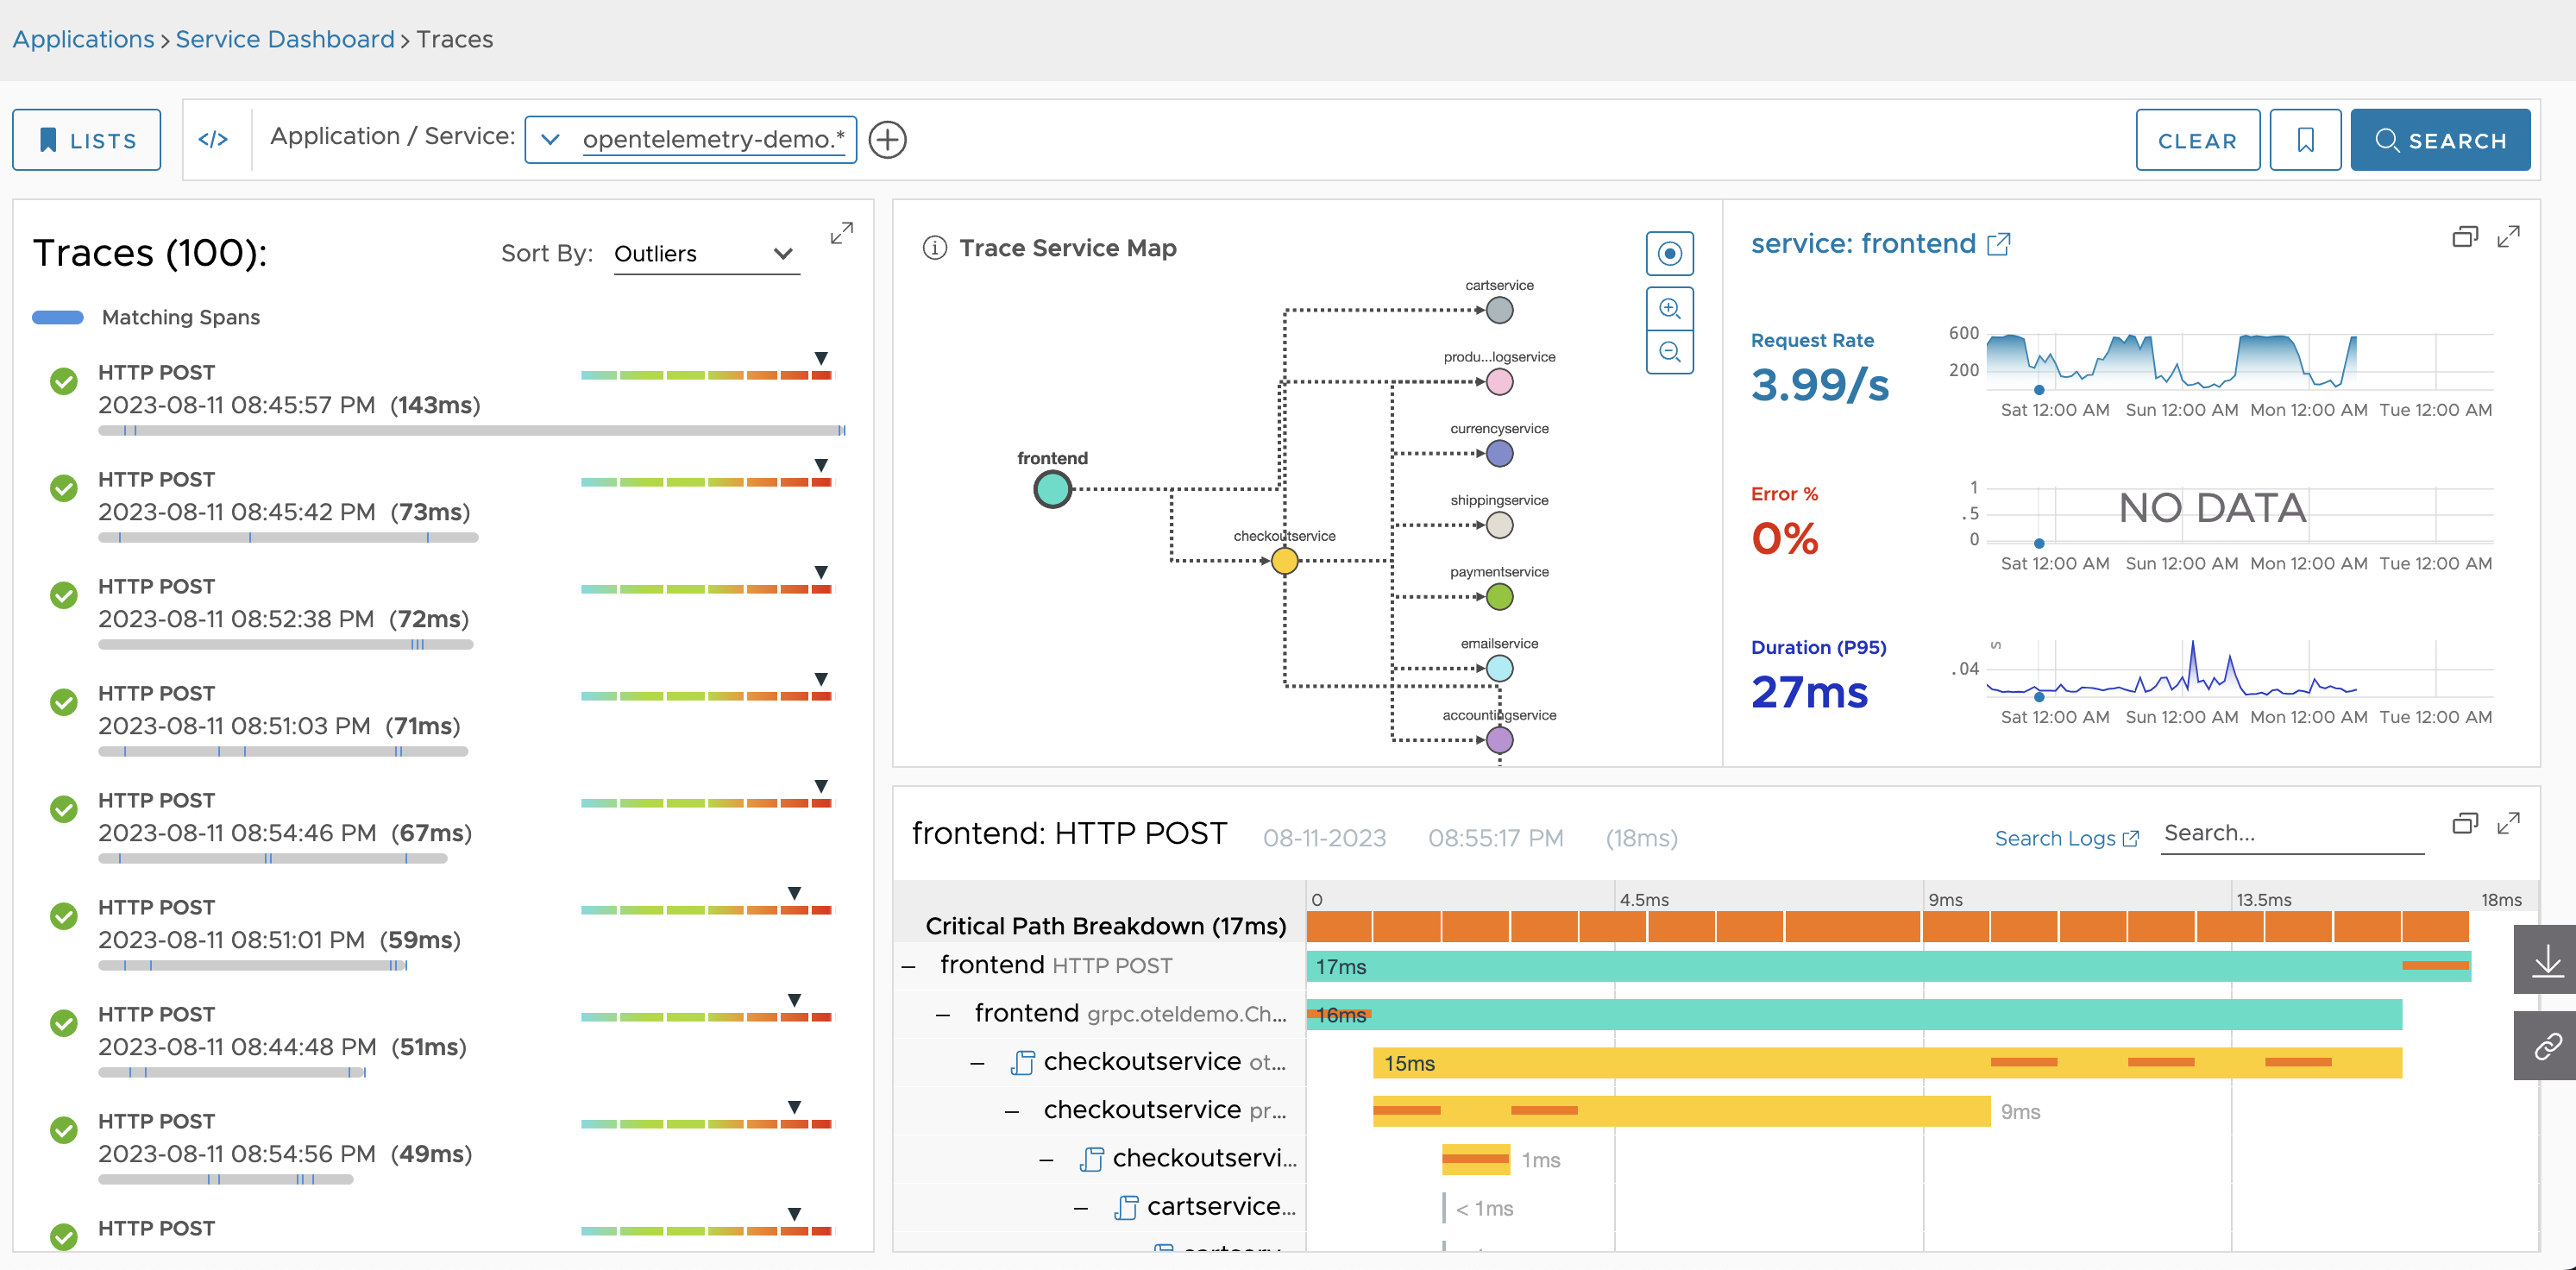
- View the traces and spans on the Traces Browser.
- Download the traces locally and view them later using Offline Traces.
Example: View the traces and spans on the Traces Browser, and identify the spans that take a long time to complete.