Understand how a specific service communicates with the other services in the application.
Important: This feature is enabled only for selected customers. To participate, contact your account representative or
technical support.
When you troubleshoot an application, you might need an overview of how a service communicates with the other services. The Service map helps you visualize this information.
Note: If you are using eBPF, you don’t send traces to our service. Therefore, you don’t see the option to drill down to the Traces Browser.
Service Map Features
The service map lets you focus on a specific service, view Request, Error, and Duration (RED) metrics for each service, and the tracing traffic for that service. You can also drill down to the Service Dashboard and Traces Browser.
To open the service map:
- Log in to your service instance.
- From the toolbar, select Applications > Service and Applications.
- Table view: Click Service Map for a specific service.
- Grid view: Click Actions > View Service Map for a specific service.
Let’s walk through the following scenario and get a quick overview of the service map.
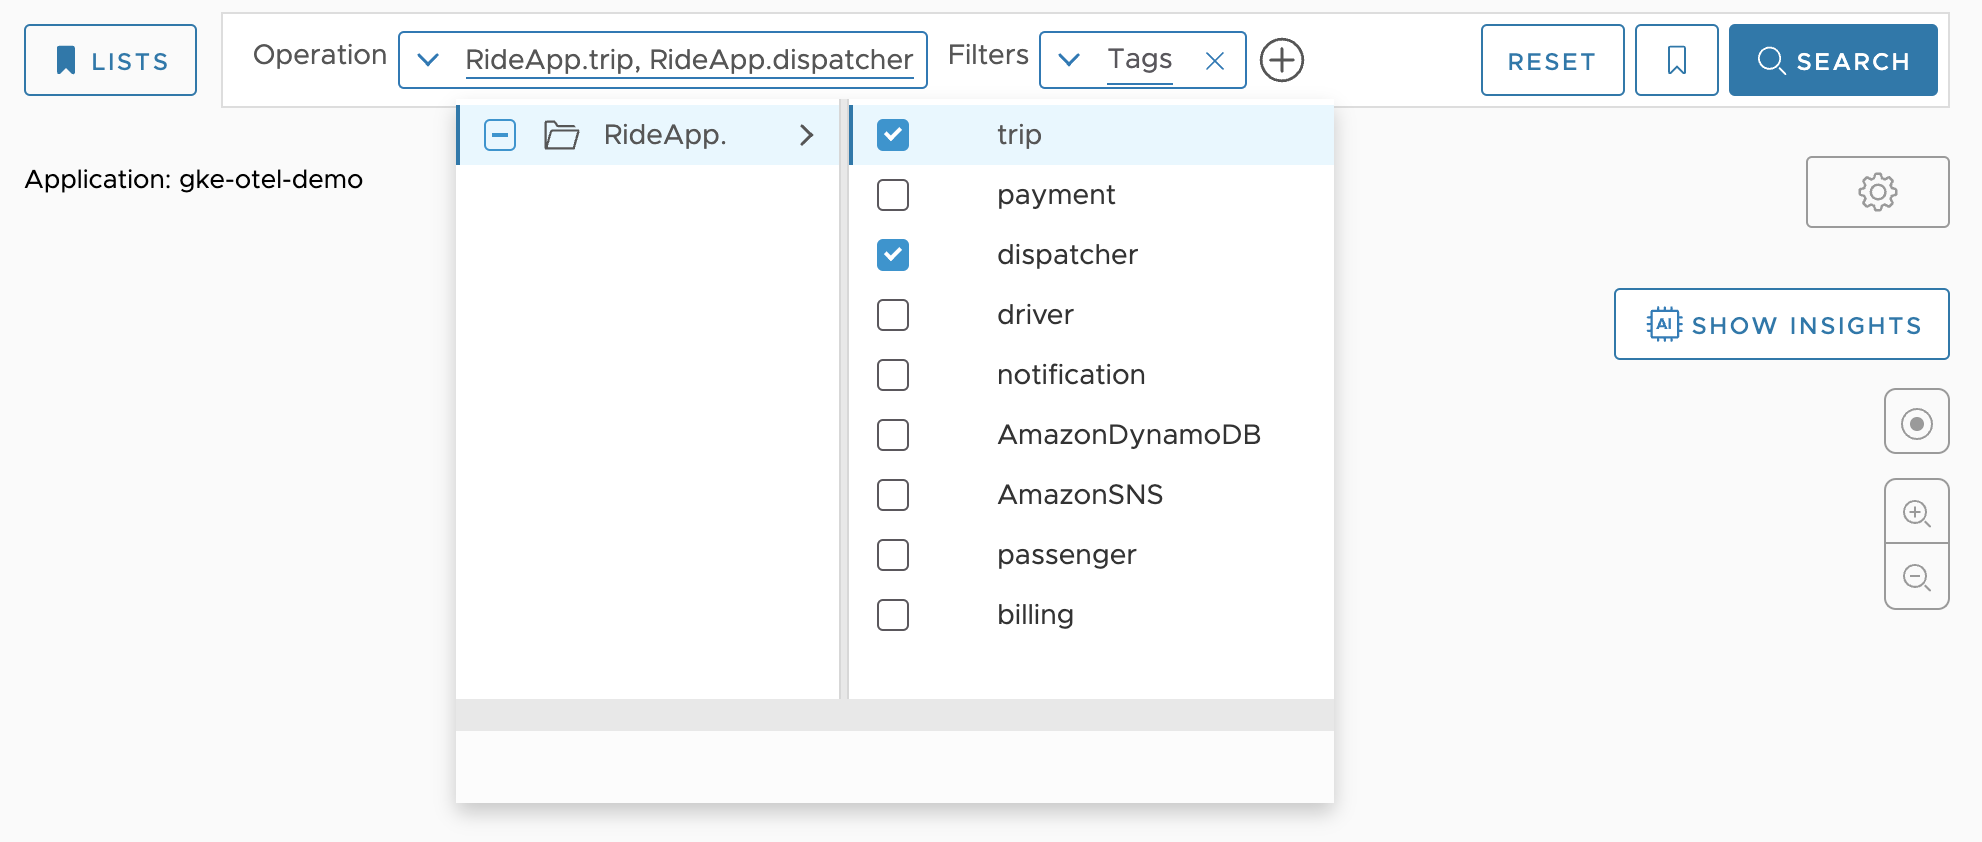
Add More Services
Next to Operation, click the drop-down menu. All the services are selected for you by default. You can deselect the services you don't want to see on the map and click Search.
You can refine your search by applying one or more filters, such as the cluster, shard, or span.kind.
You see the data that match your search filters and the nearest neighboring service. For example, if you filter for the beachshirts application's styling service, you only see the services that directly communicate with the styling service.
|
|
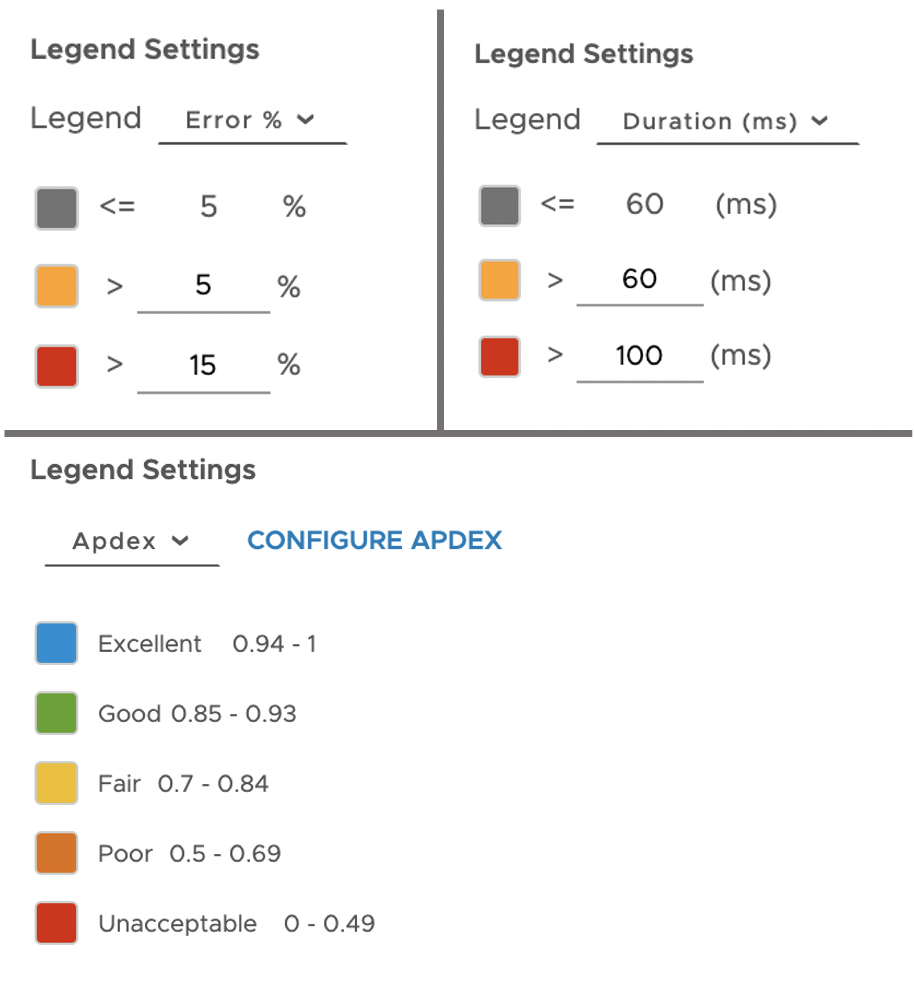
Update the Legend
Click the settings icon and select Apdex, Error, or Duration. These settings can be configured by each user.
-
Error Percentage: Update the legend to highlight the data based on the error percentage. Select Error % from the drop-down and customize the values. The values need to be in ascending order.
-
Duration: Update the legend to highlight the data based on the duration. Select Duration from the drop-down menu and customize the values. The values need to be in ascending order and in milliseconds.
-
Apdex: Update the legend to highlight the data based on the Apdex score. Select Apdex from the drop-down menu. Only Super Admin users and users with the Applications permission can configure the threshold (T).
|
|
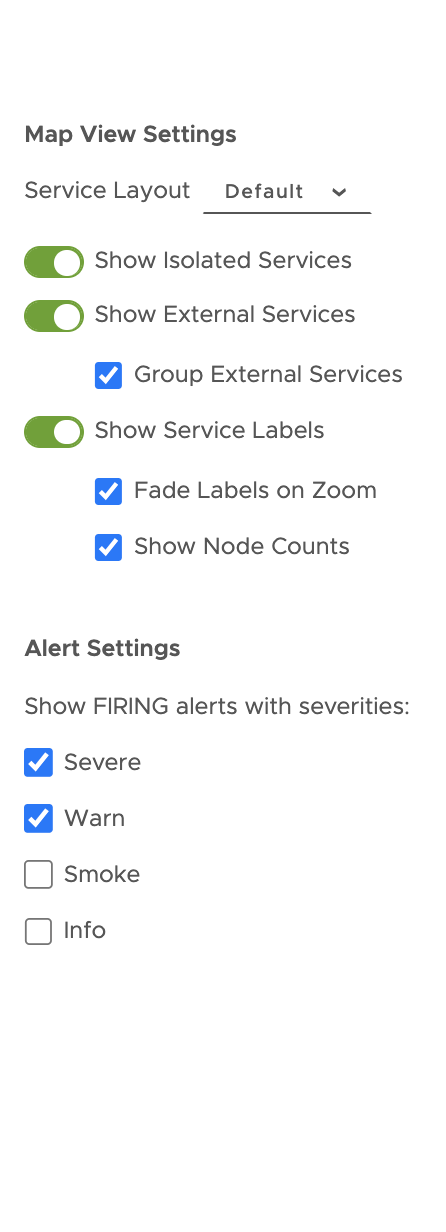
Customize the Service Map View
Click the settings icon to customize how you see the services on the service map.
-
Service layout: Select to view the services in the default, concentric, circle, or grid layout. Choose the layout that helps you understand how your services are linked.
-
Show Isolated Services: Enable this option to see the services that don't interact with any other services or applications.
-
Show External Service: Enable this option to see the external applications or services, such as AWS services or Database services, your application communicates with. You can group these services too.
-
Group External Services: Select this option if you want to group services. For example, group all the database services and view it as a single external service.
- Show Service Labels: When you have many services in an application, the service names on the service map look cluttered. To get a clear view of your application and services, disable the Show Service Labels option or select Fade Labels on Zoom.
-
Fade Labels on Zoom: Hides the labels of small services and gradually exposes them as you zoom in on the service map. You always see the labels of the services in red, based on the legend settings you select.
-
Show Node Counts: Shows the number of instances of a service running in an application. For example, shopping (5) shows you that there are five instances of the shopping service in the beachshirts application.
-
Alert Settings: Select the severity of the alert you want to see on the service map. For example, if you select Severe, you see the alerts that have the severity status set to severe marked with a red dot on the service map.
|
|
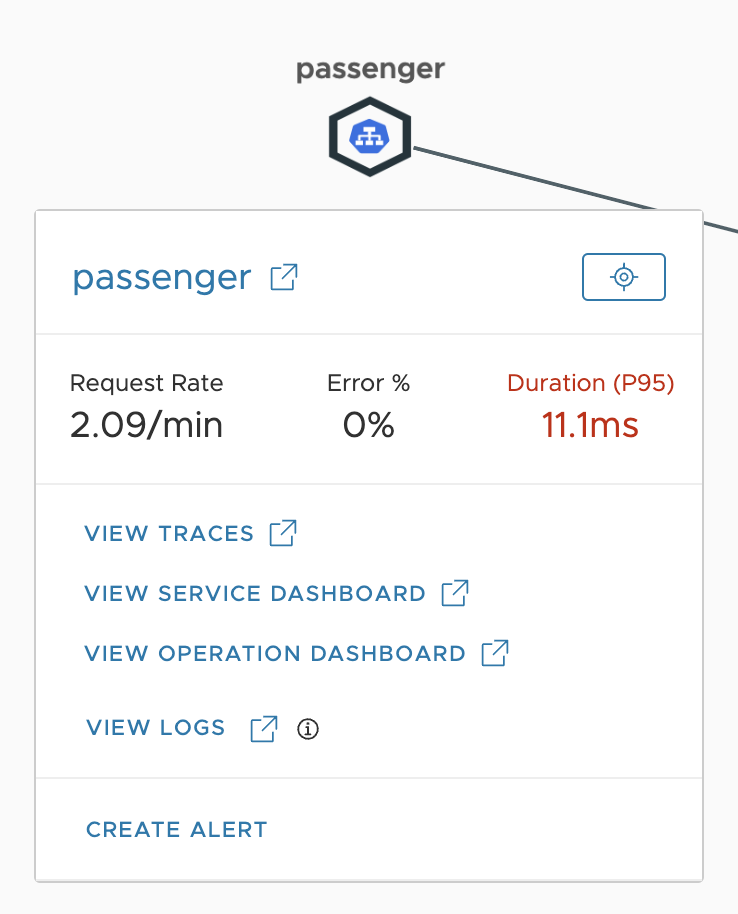
Click on the styling service. Now, you can:
- View Request, Error, and Duration (RED) metrics of the specific service.
- See how the service is performing using the Apdex score.
- View how a specific service communicates with the other services in an application by clicking the Focus icon.
- Navigate to the Traces Browser by clicking View Traces. You don't see this option if you are using eBPF.
- Click Actions to:
- Navigate to the Traces Browser by clicking View Traces. You don't see this option if you are using eBPF.
- Navigate to the Operation Dashboard by clicking View Operation Dashboard.
- Navigate to the Service Dashboard by clicking View Service Dashboard.
- Navigate to the Logs Browser by clicking View Logs.
- Click Create Alerts to create smart alerts that filter noise and capture true anomalies. See Create an alert.
- If an alert you created is firing, you can see a red dot with a number on the service. The number indicates how many alerts are firing for a specific service. To see the alerts, click view alerts.
- Configure the apdex settings by clicking the Edit icon next to the Apdex score.
|
 |
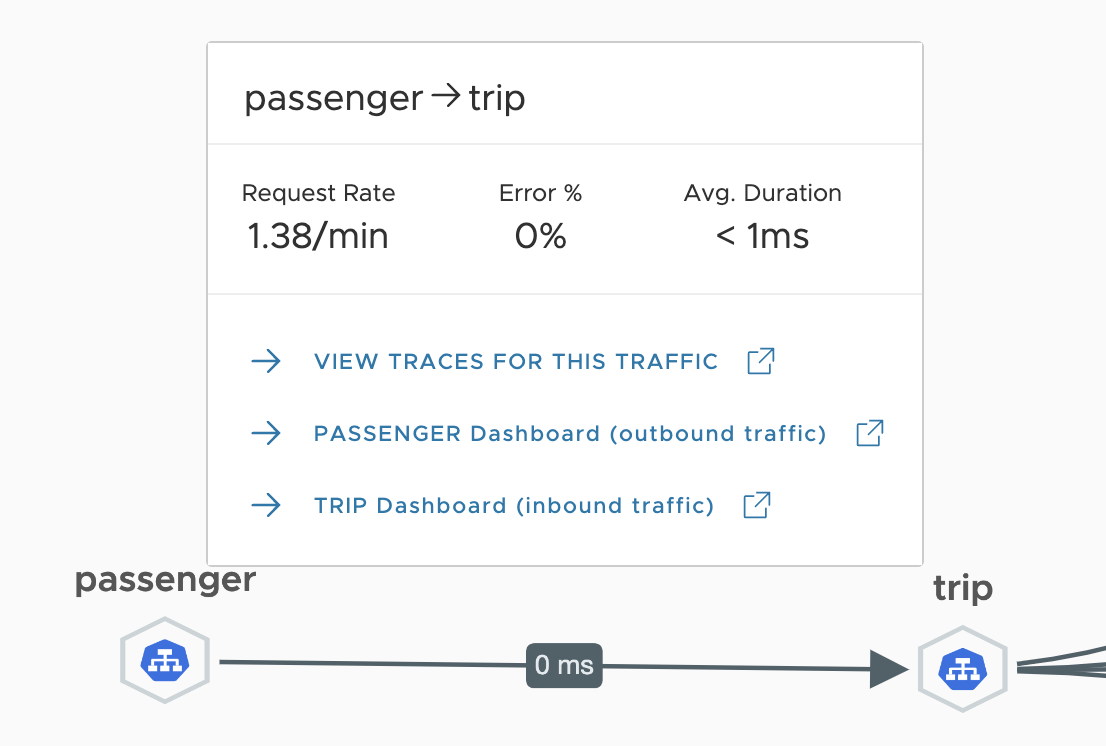
When you click on the service traffic between the styling and printing service, you can:
- View Request, Error, and Duration (RED) metrics for the specific edge.
- Navigate to the Traces Browser by clicking View Traces for This Traffic. You don't see this option if you are using eBPF.
- Navigate to the Operation Dashboard to view RED metrics of the outbound and inbound operations by clicking View Passenger Dashboard (Outbound Traffic) or View Trip Dashboard (Inbound Traffic).
|
 |
Learn More!